
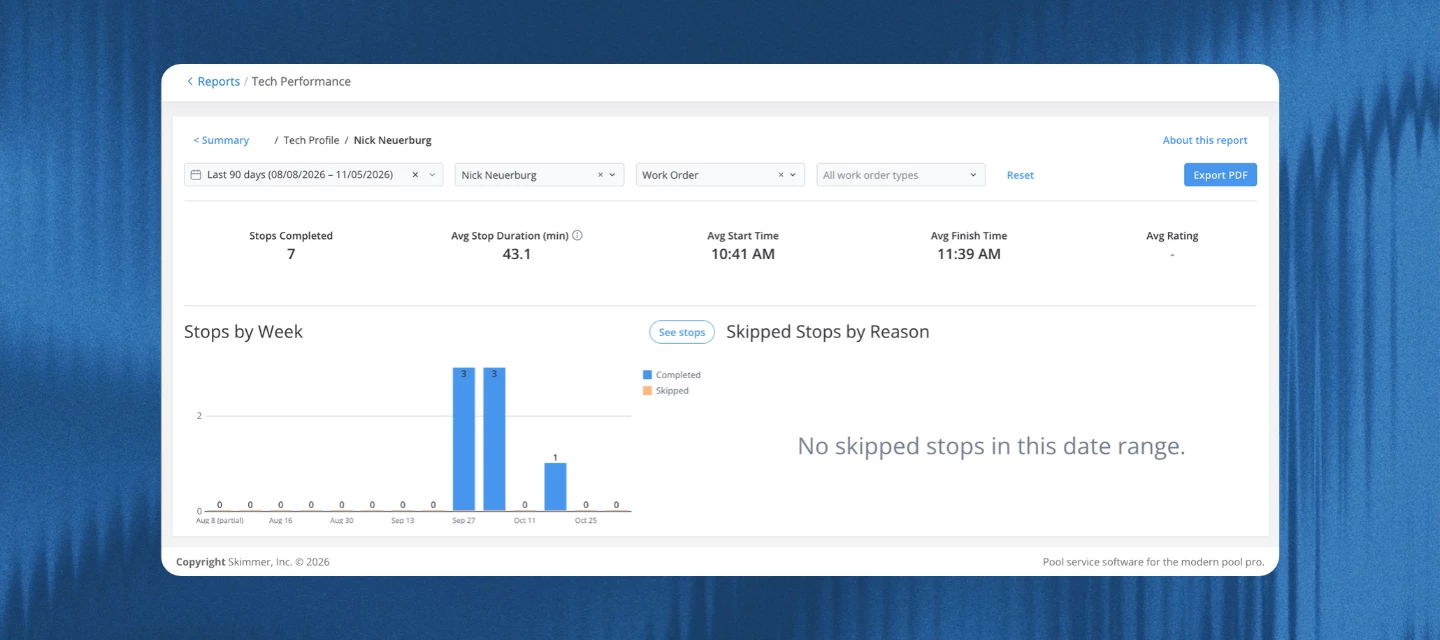



One question we hear a lot from owners running a crew: how's each tech actually doing? Until now, answering it meant pulling route history and reviews one tech at a time.
Starting today, it's one report. The tech performance report shows how many stops each tech completes, how long their stops take, and how customers rate them, all next to your team average.
NOTE: this feature is included in Scaling Up and Enterprise
Compare stops, time per stop, and ratings against your team average.
The summary page shows your team's totals compared to the previous period, plus charts for stops and average stop time by tech with a team average line. The table below lists every tech's numbers in one place, including skipped stops and their average start and finish times.
Back up coaching conversations with real numbers.
Click any tech's name to open their profile. You'll see their stops and stop time over time, why they skipped stops, and how their ratings break down from 5 stars to 1. You can open their full stop list and every piece of feedback, then export the profile as a PDF for your one-on-one.
Spot changes in stop time or stop count early.
The trend chart gives each tech their own line, so you can see when someone's stop time or stop count starts to change. Show or hide techs from the legend to focus on one or two.
Good to know
- Owners and admins can open the report. It's included on Scaling Up and Enterprise.
- Stops under 1 minute, and stops over 2 hours (4 hours for work orders), still count toward stops completed, but they're left out of the average so it stays fair. If a tech has a lot of short stops, it's worth checking how they use the app.
- Start and finish times are the first stop started and the last stop completed each day. They aren't clock-in or clock-out times.
Tips
- Use the Stop type filter to compare similar work. The report opens on cleanings, and techs who do more work orders will show longer stop times.
- Ratings can swing on one response, since most techs get only a few a month. Check the rating distribution on a tech's profile, not just the average.
- Export the table to CSV, Excel, or PDF, or export a tech's profile as a PDF to bring to a one-on-one.
- Try it now: Go to Reports > Tech Performance.
- Want more details? Read the help article
What would you want to see in this report next? Let us know below. Your feedback helps shape what comes in the next version.