
Scroll down for a detailed guide on how to use this report.
Tiers: Scaling Up, Skimmer for Enterprise
View the products, parts, bulk chemicals, or other items which have been marked as installed by techs during service.
Step-by-step instructions
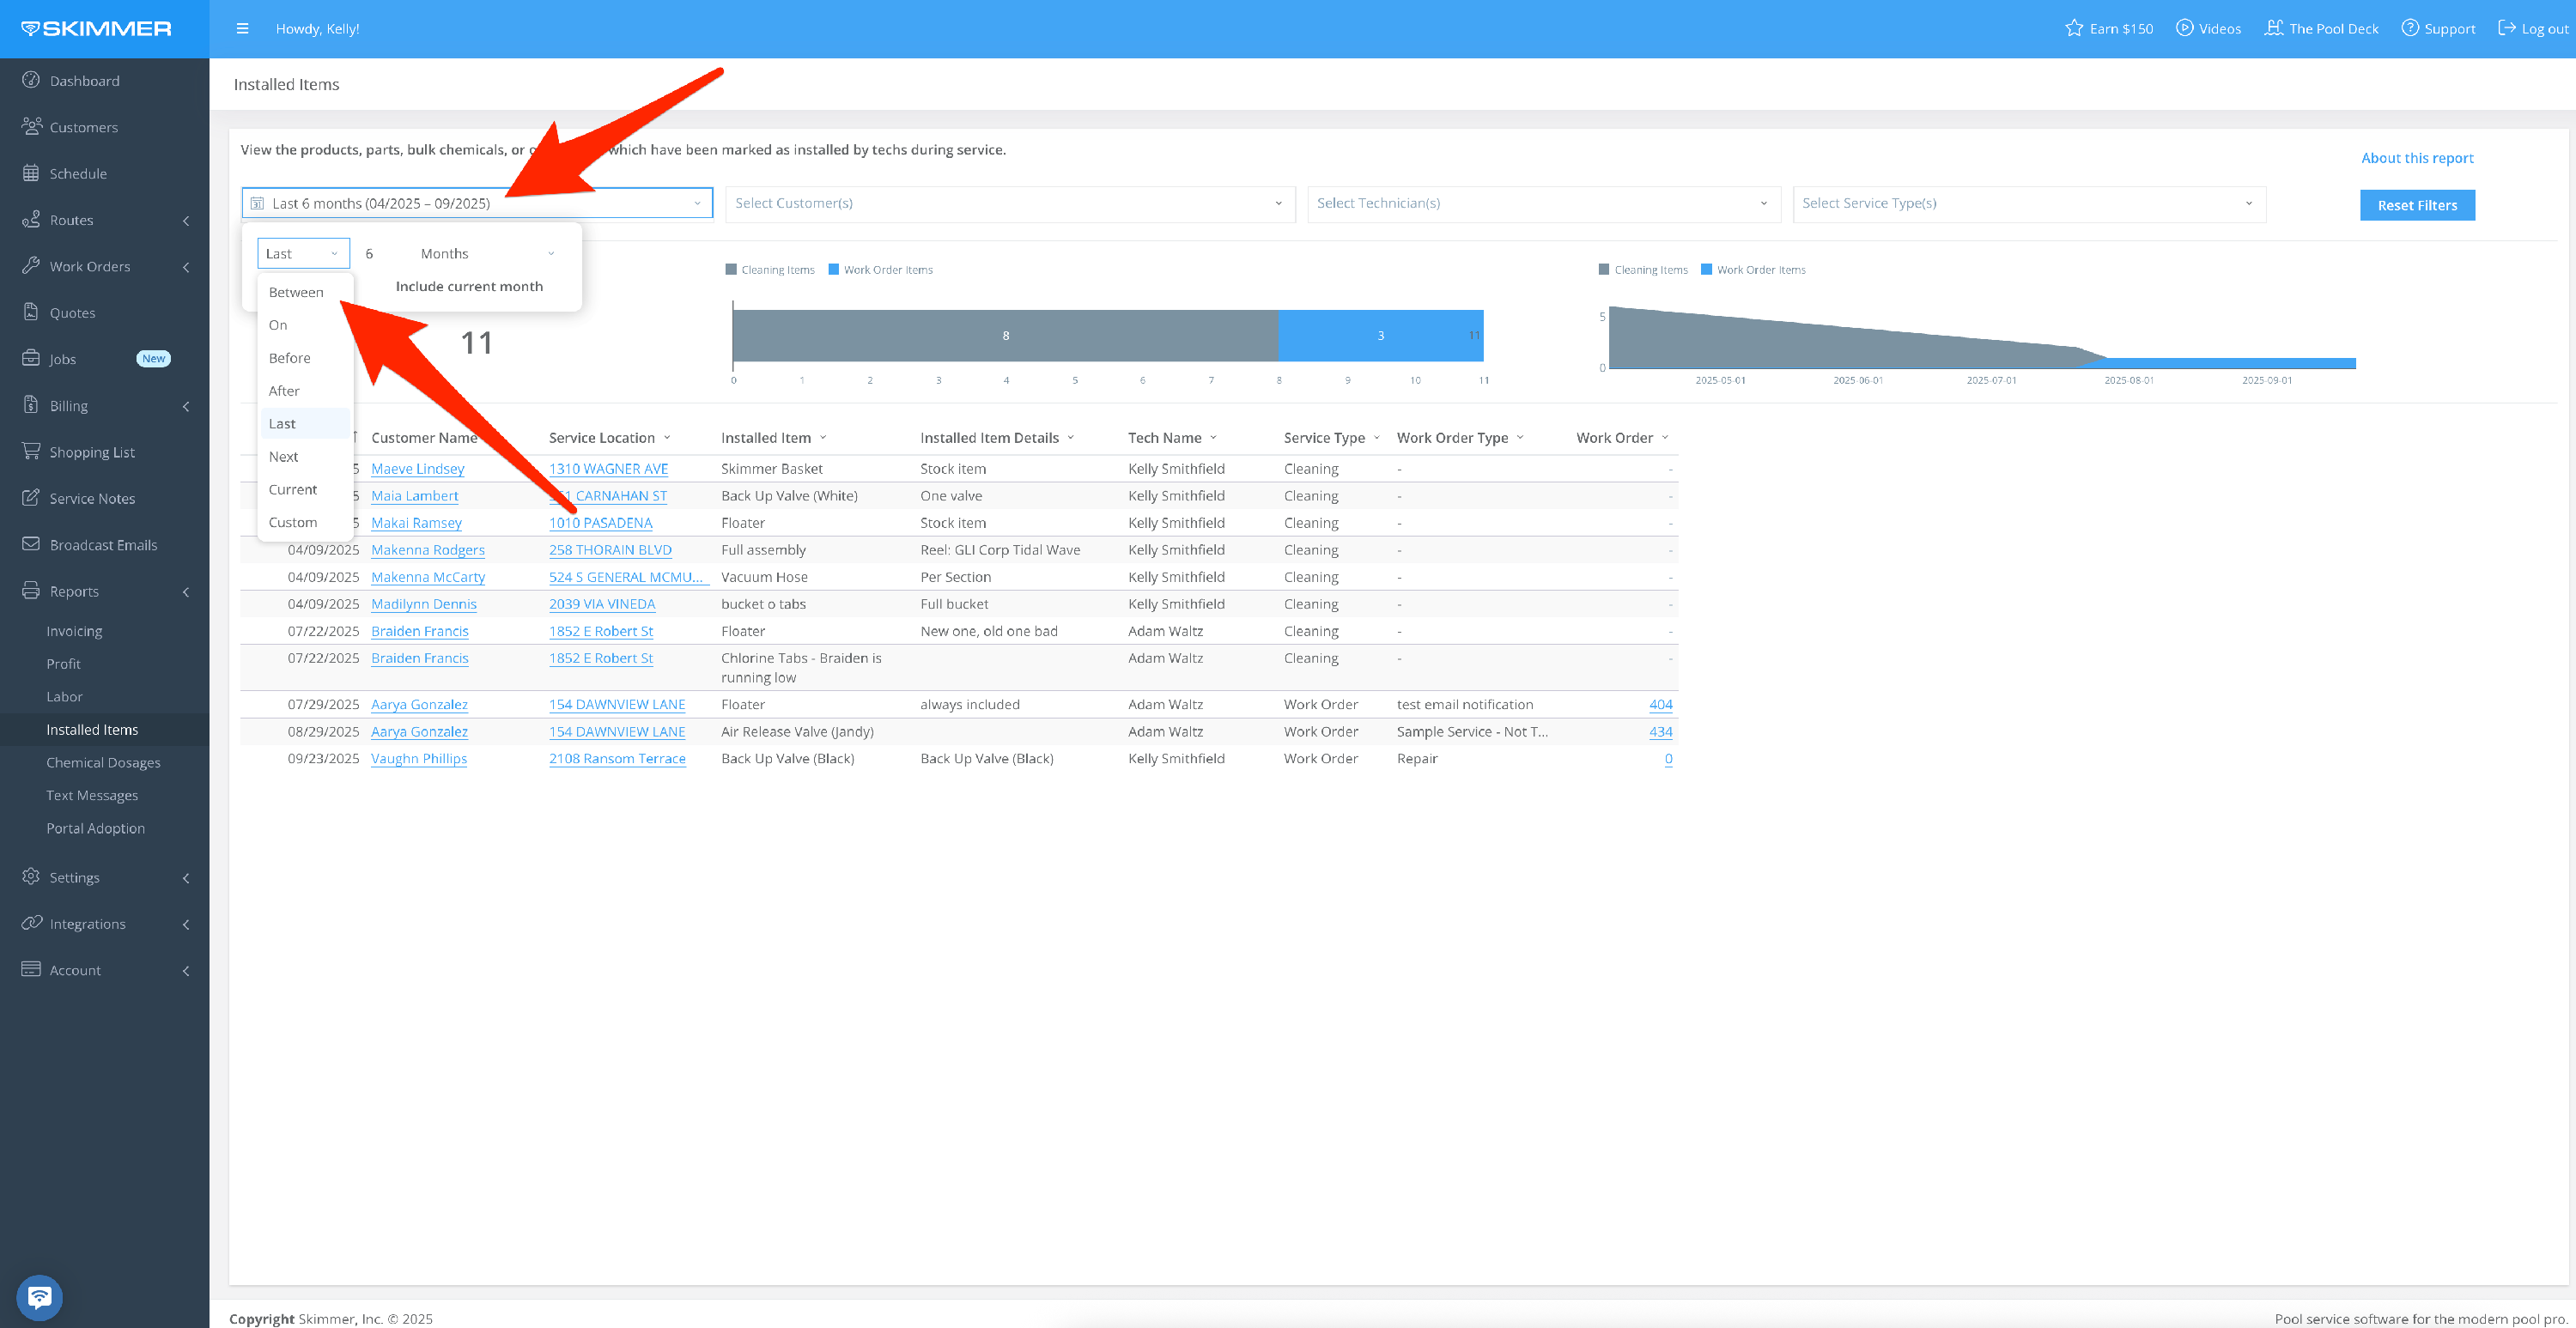
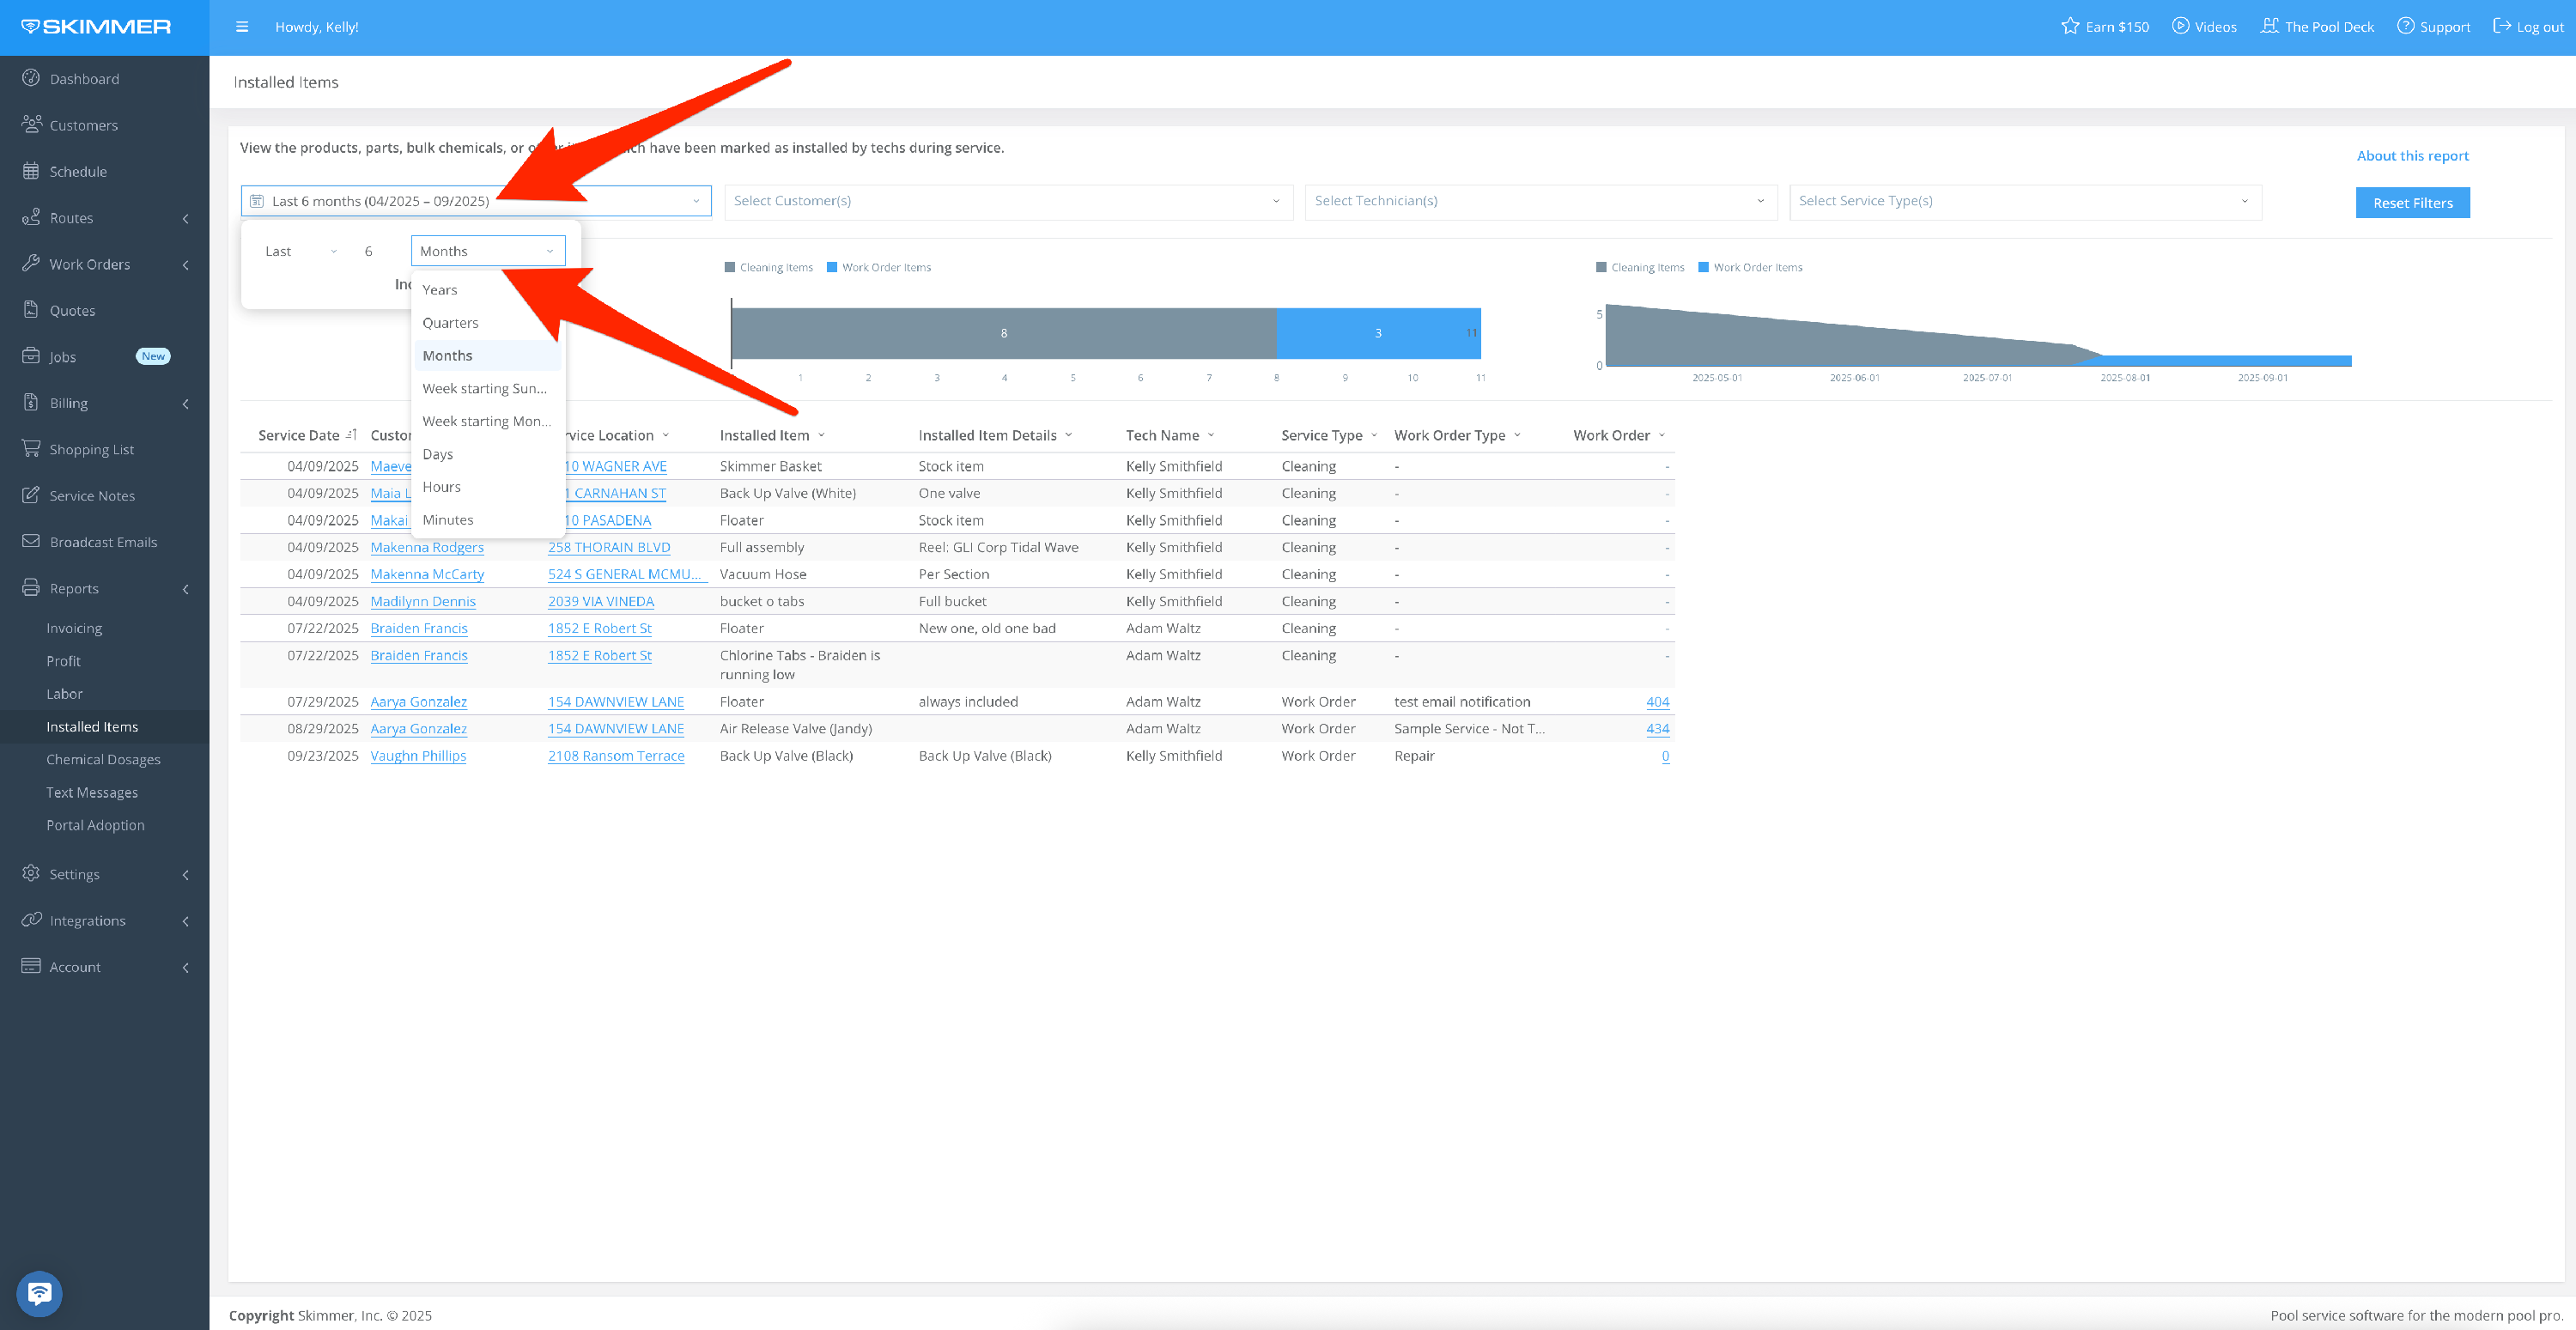
1. Filter by Date Range:
- Between: Select two dates, creating a date range
- On, Before, or After a specific date
- Last: set a time frame going into the past–last day/week/six months/two years, etc. even last hours or minutes, fully customizable
- Current: lets you center on now and view by current hour/day/month/quarter, and more
- Next: does not currently have information associated with it, so you won’t need to select it.
-
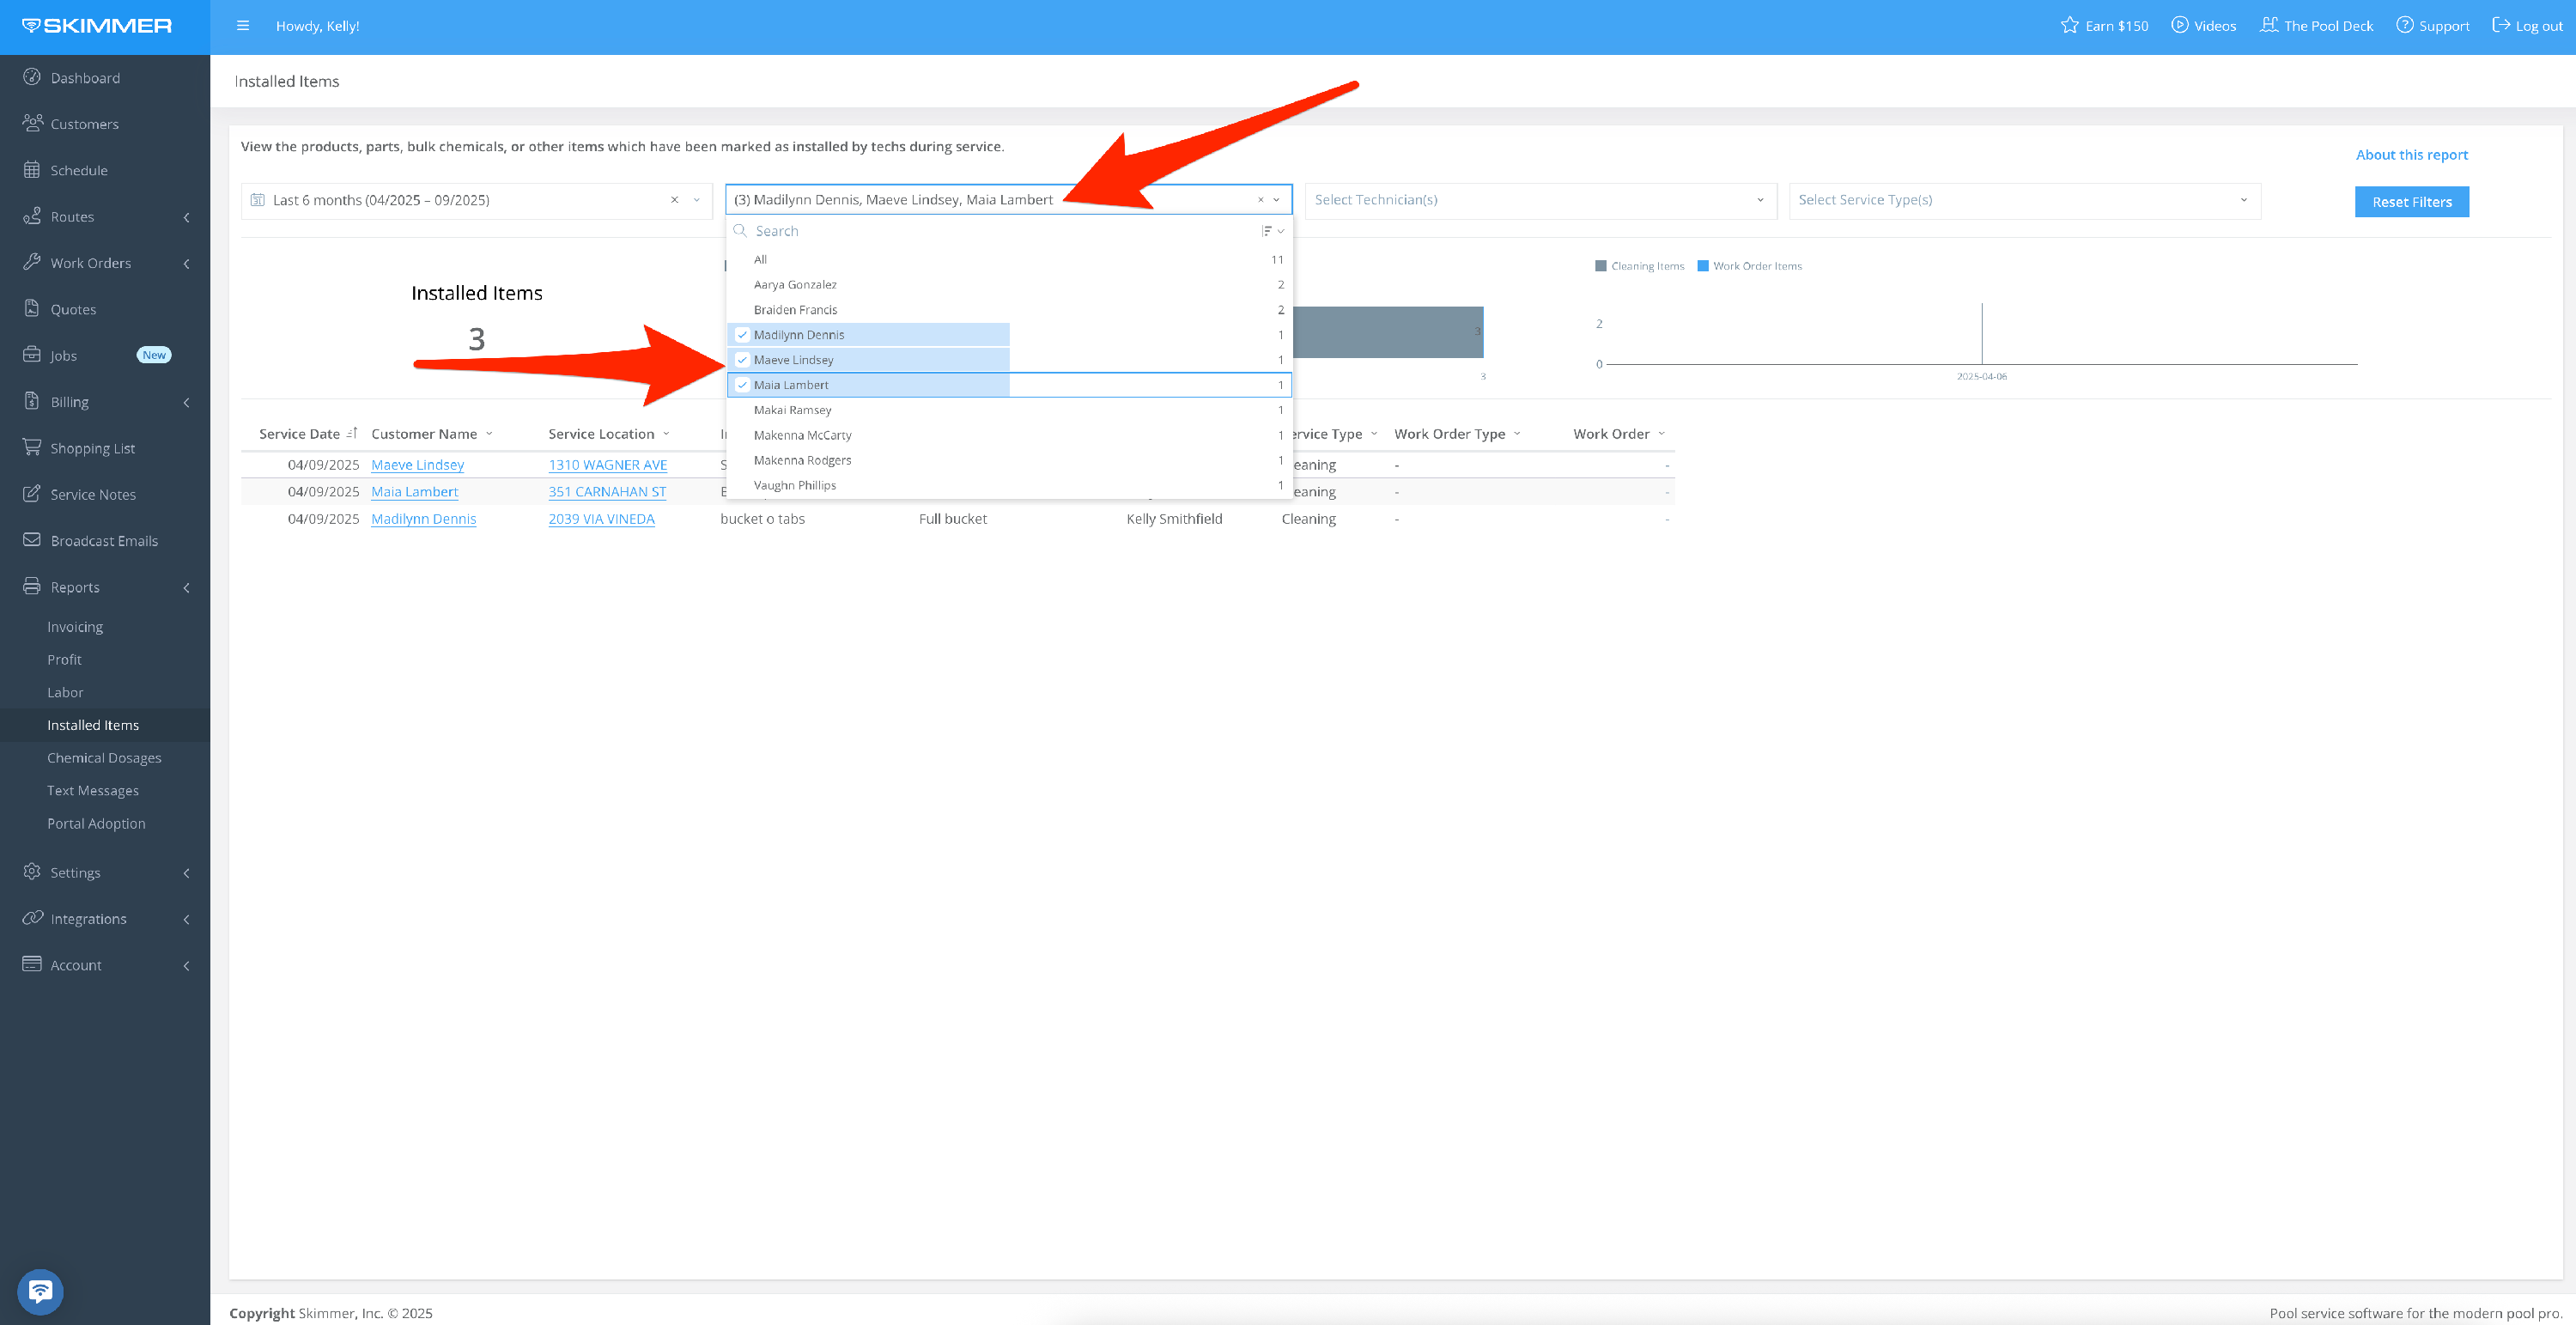
2. Filter by Customer:
- By customer name
- By multiple customers based on check boxes
- Make your choices and the list filters down, showing the same information as full list for the selected customers
- When you filter by customer, the only customer names that show up in the dropdown are the ones who have received service within the selected time frame
-
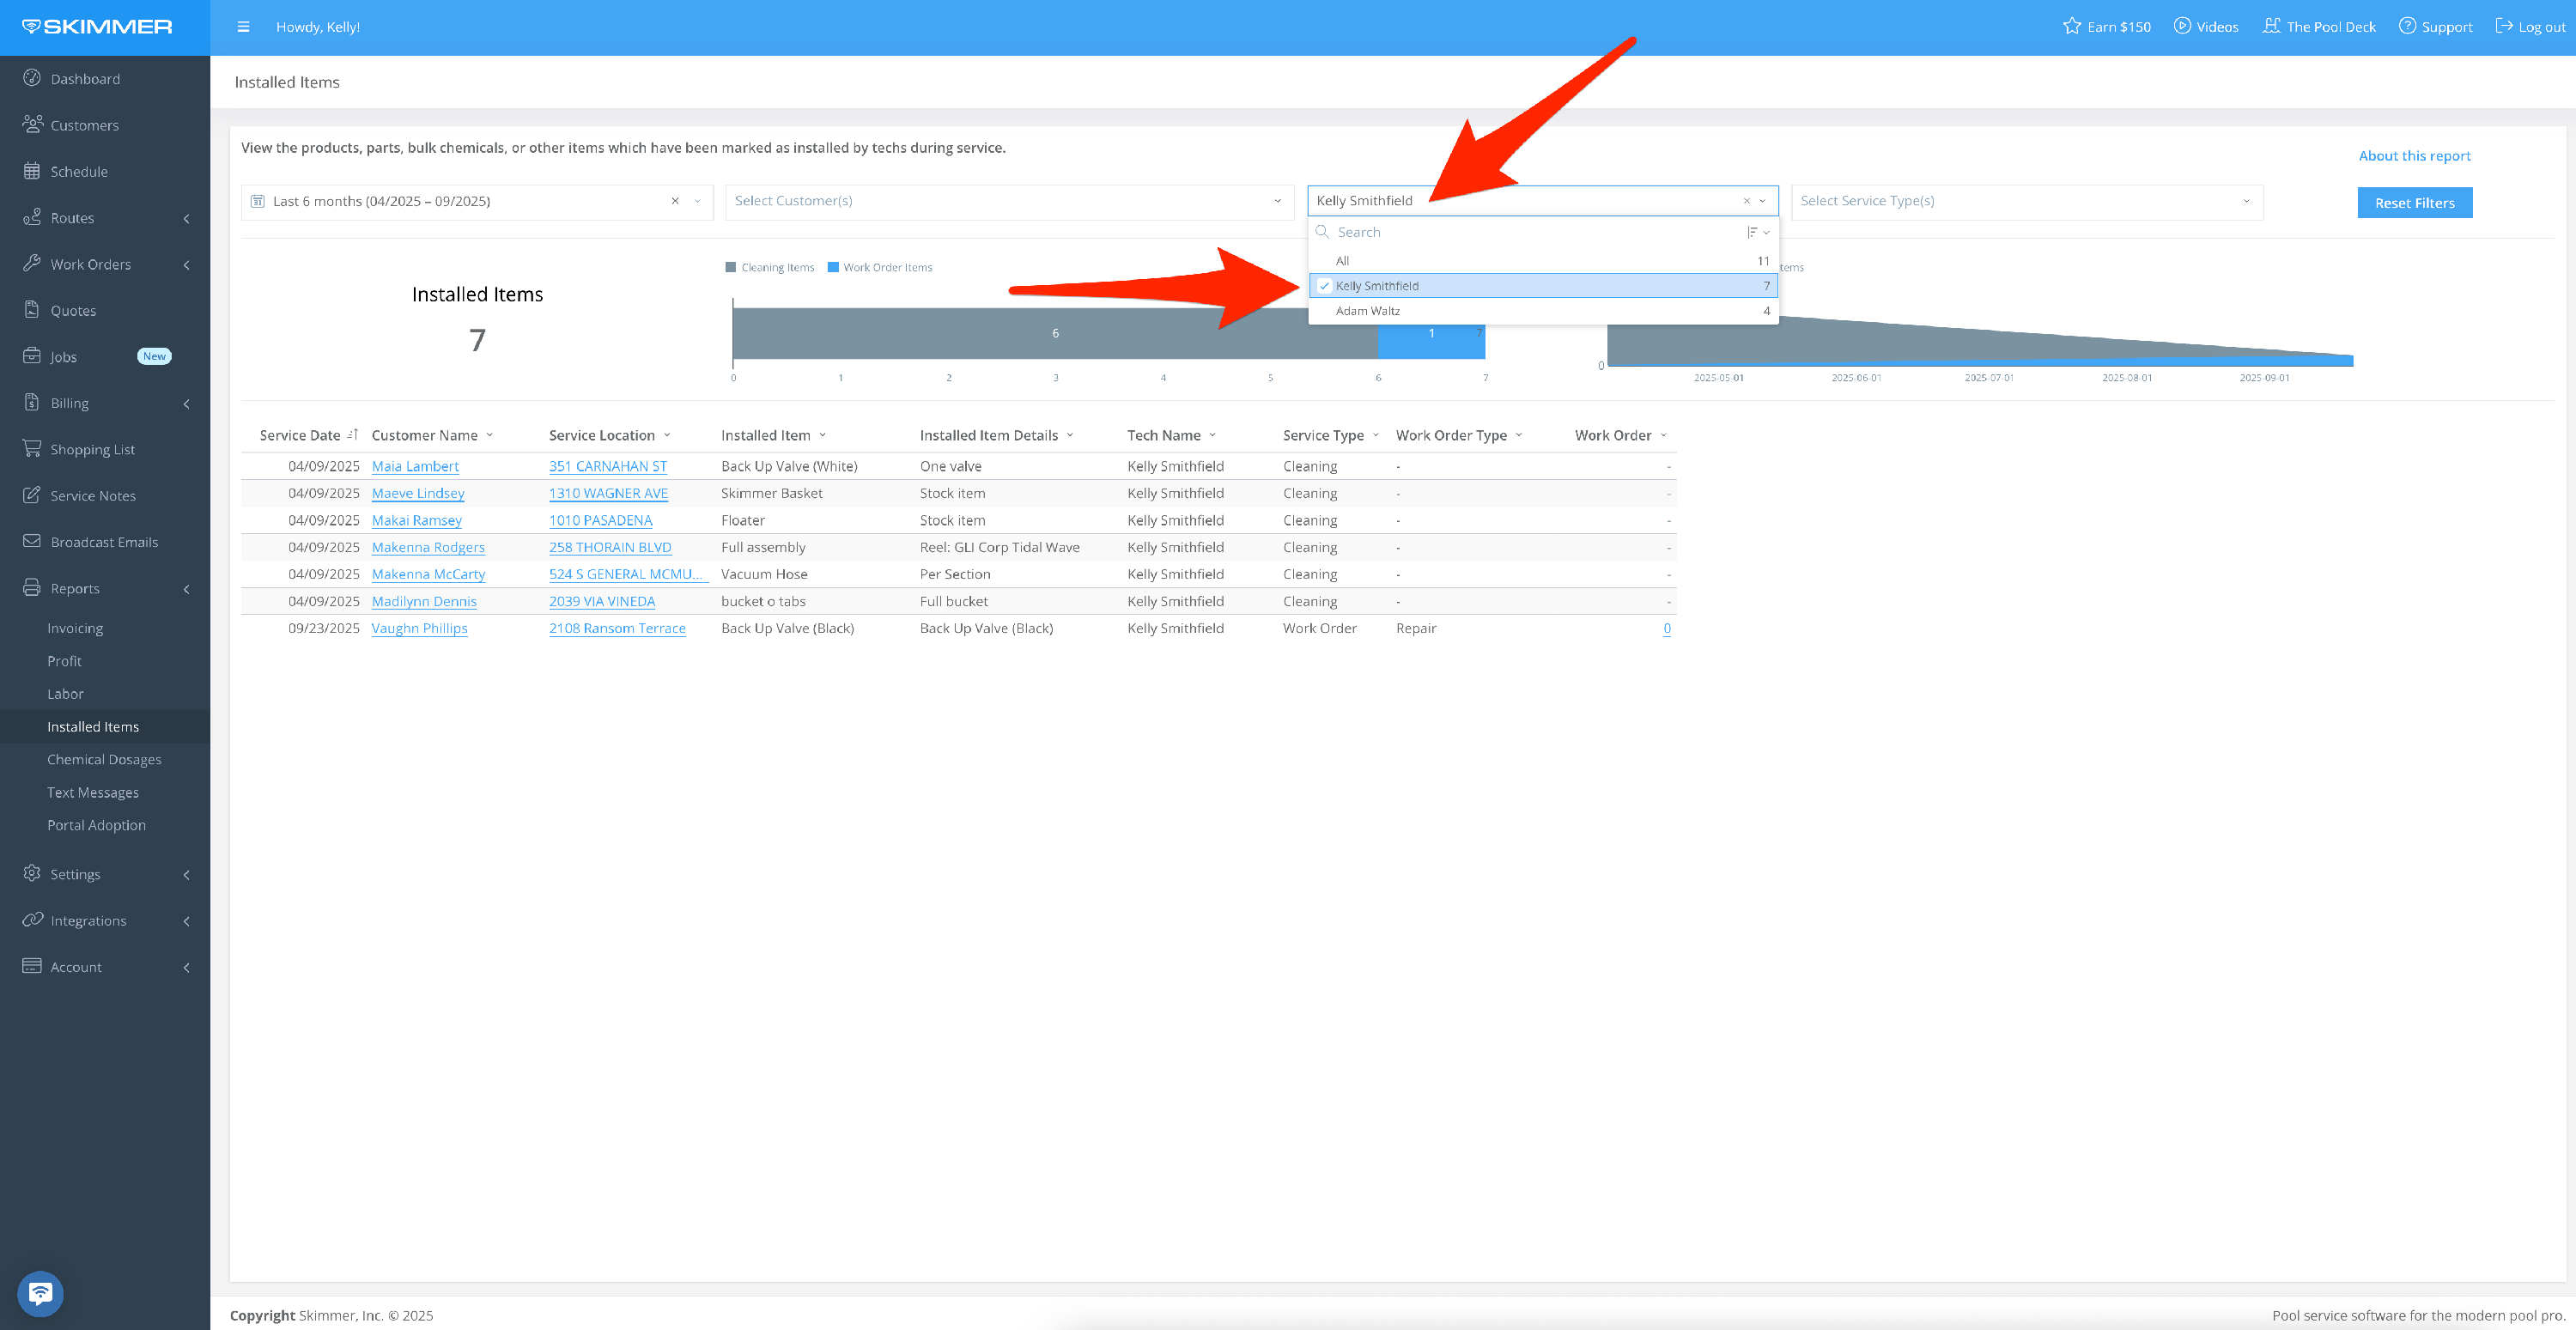
3. Filter by Technician:
- Display items marked as installed by one tech, or a select set of techs. When you filter by tech, the only names that show up in the dropdown are the ones who have performed service within the selected time frame.
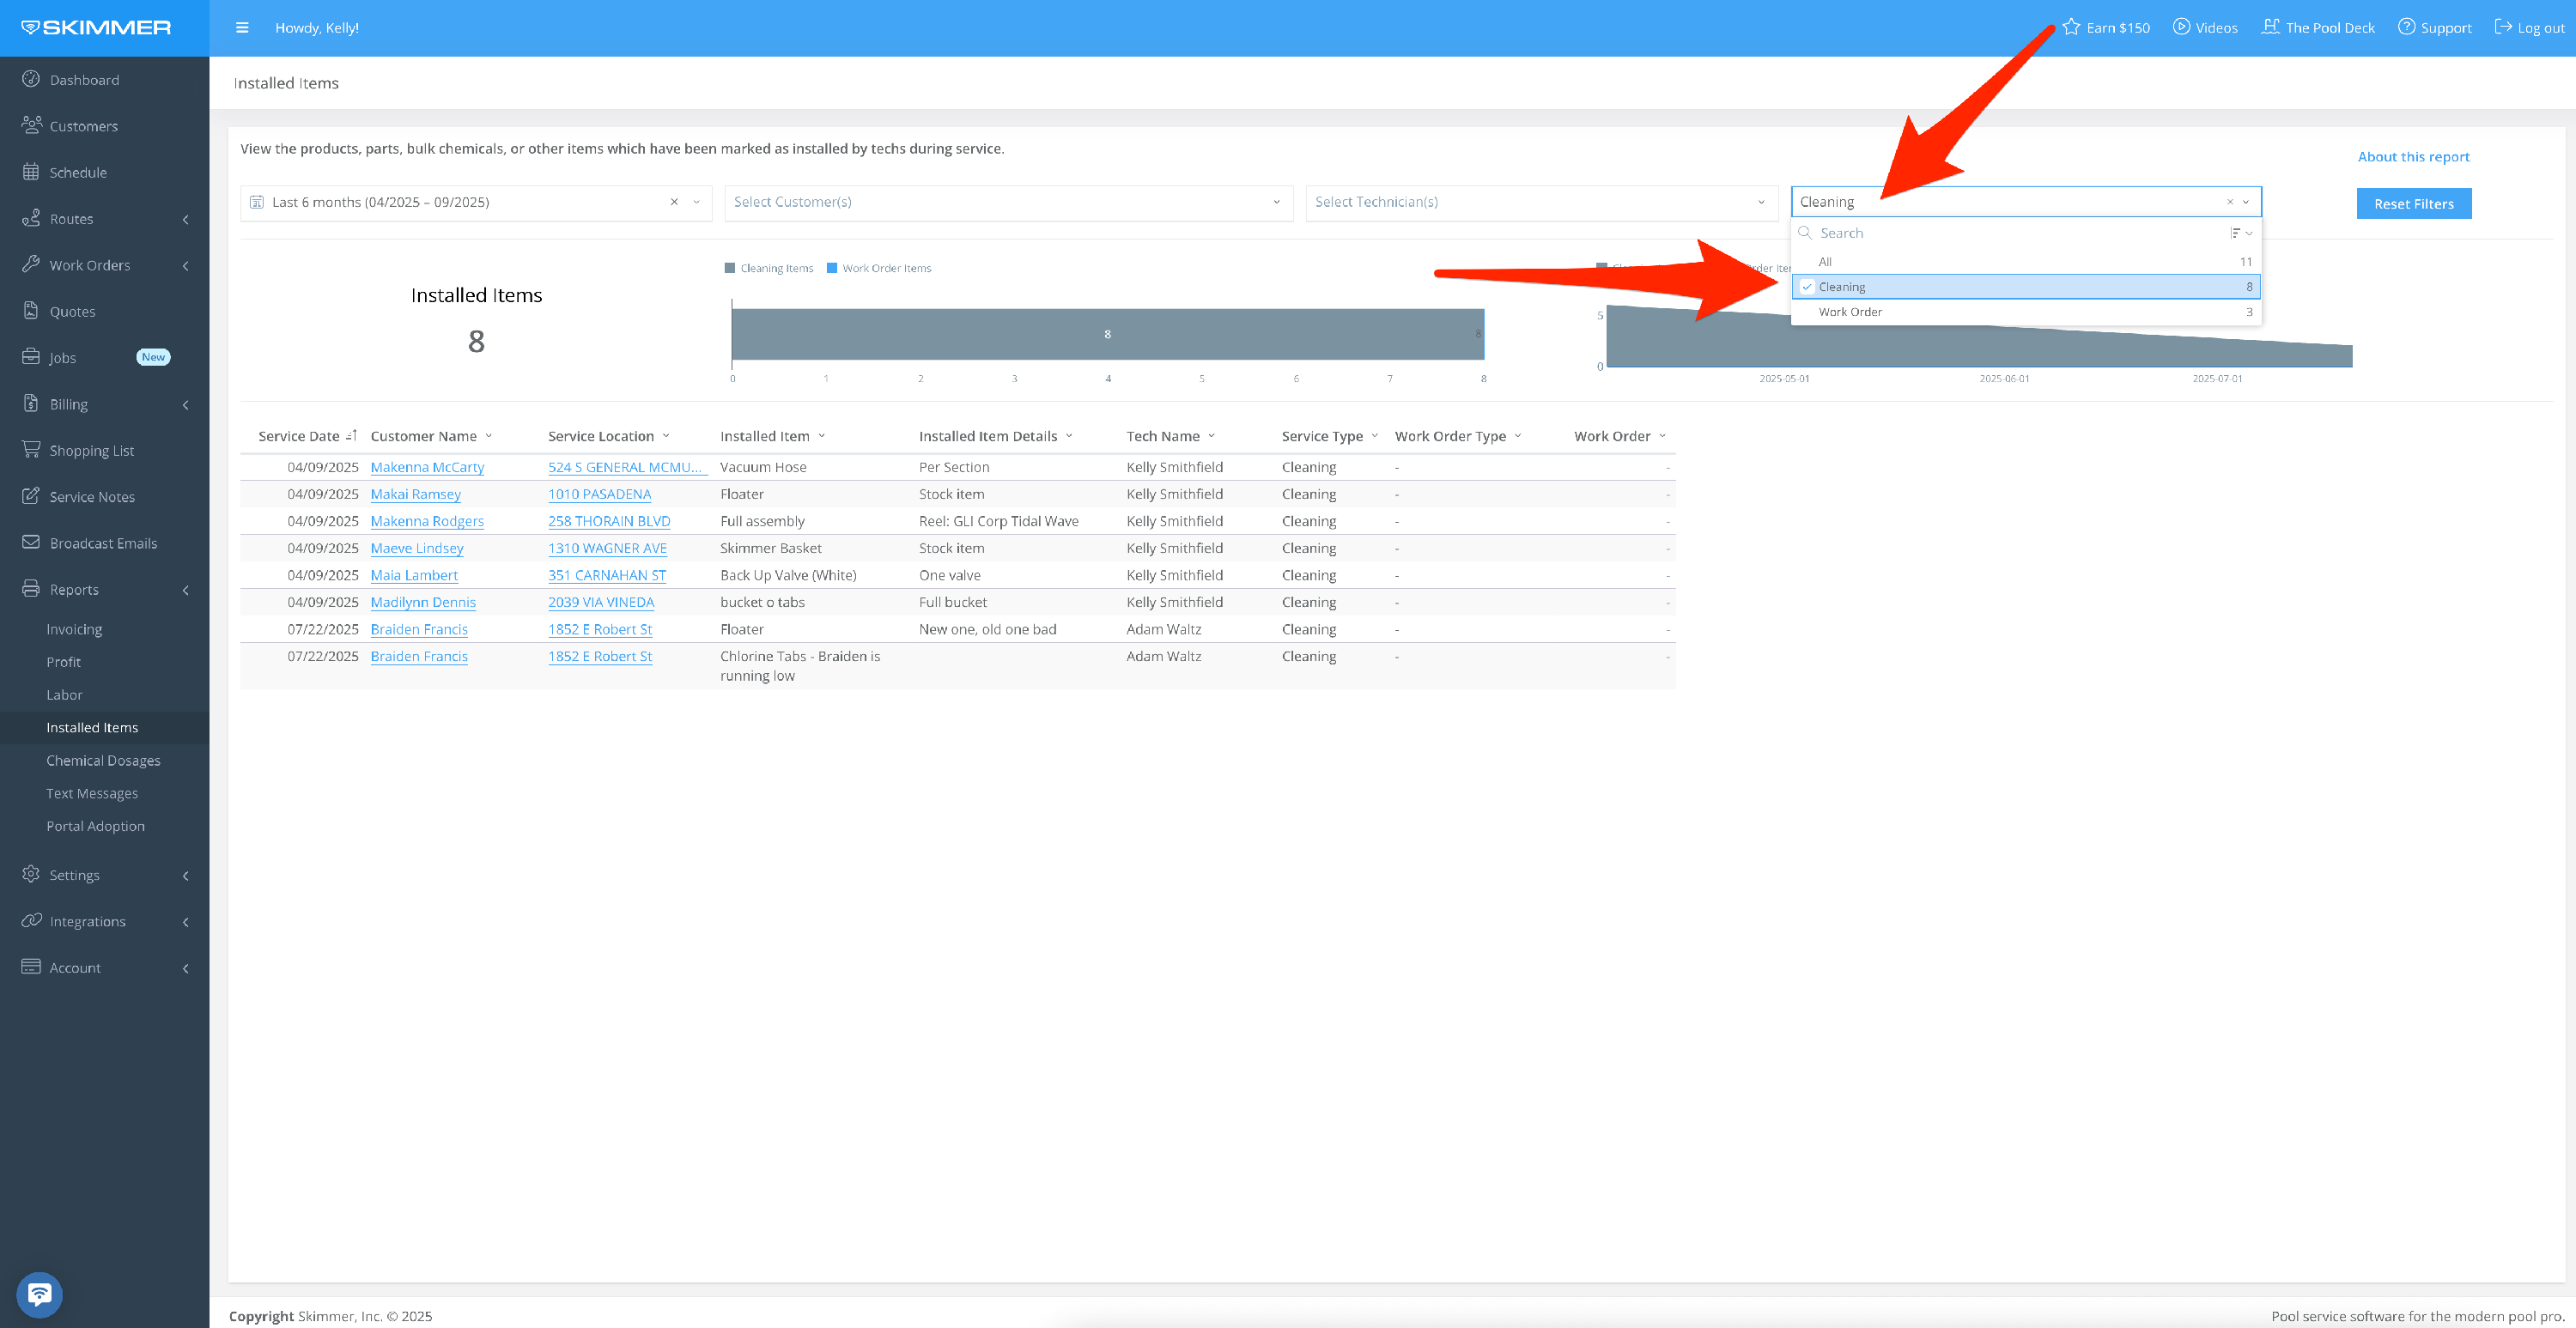
4. Filter by Service Type:
- Choose to view items installed during regular service stops (Cleaning), work order completions (Work Order), or both.
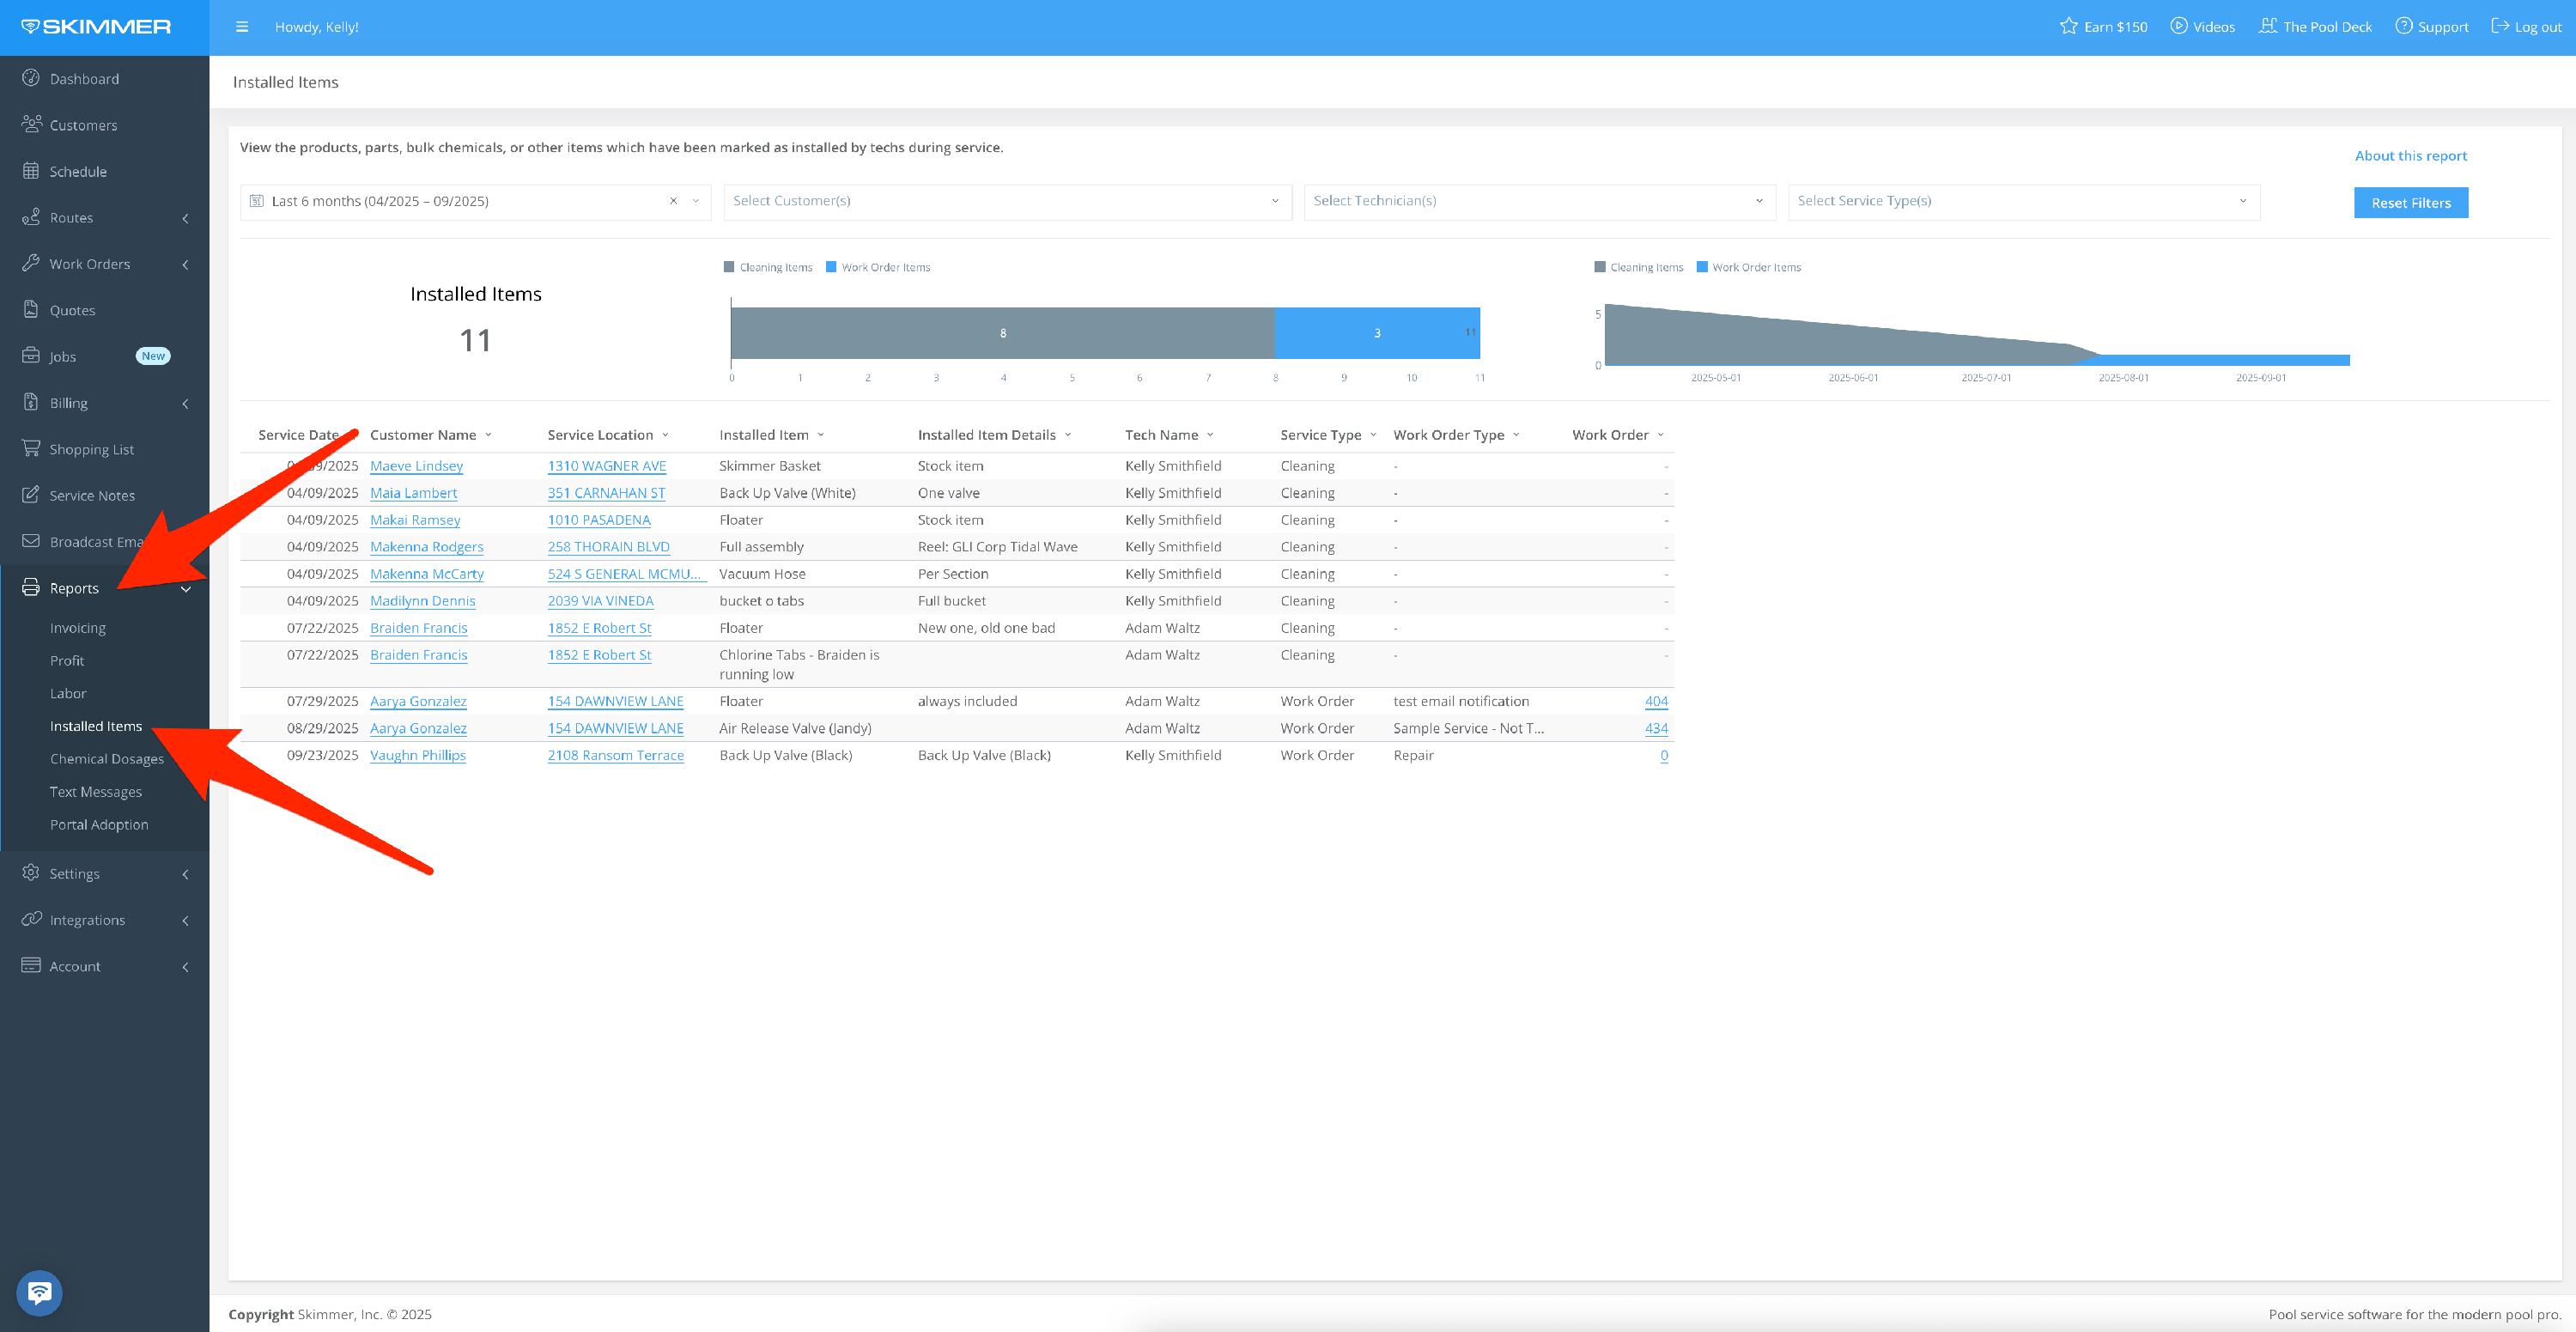
5. The filters you choose will reflect in the following areas:
- First area gives you headline metrics, the total chemical doses and customers serviced, and a breakdown of that basic information by rate type.
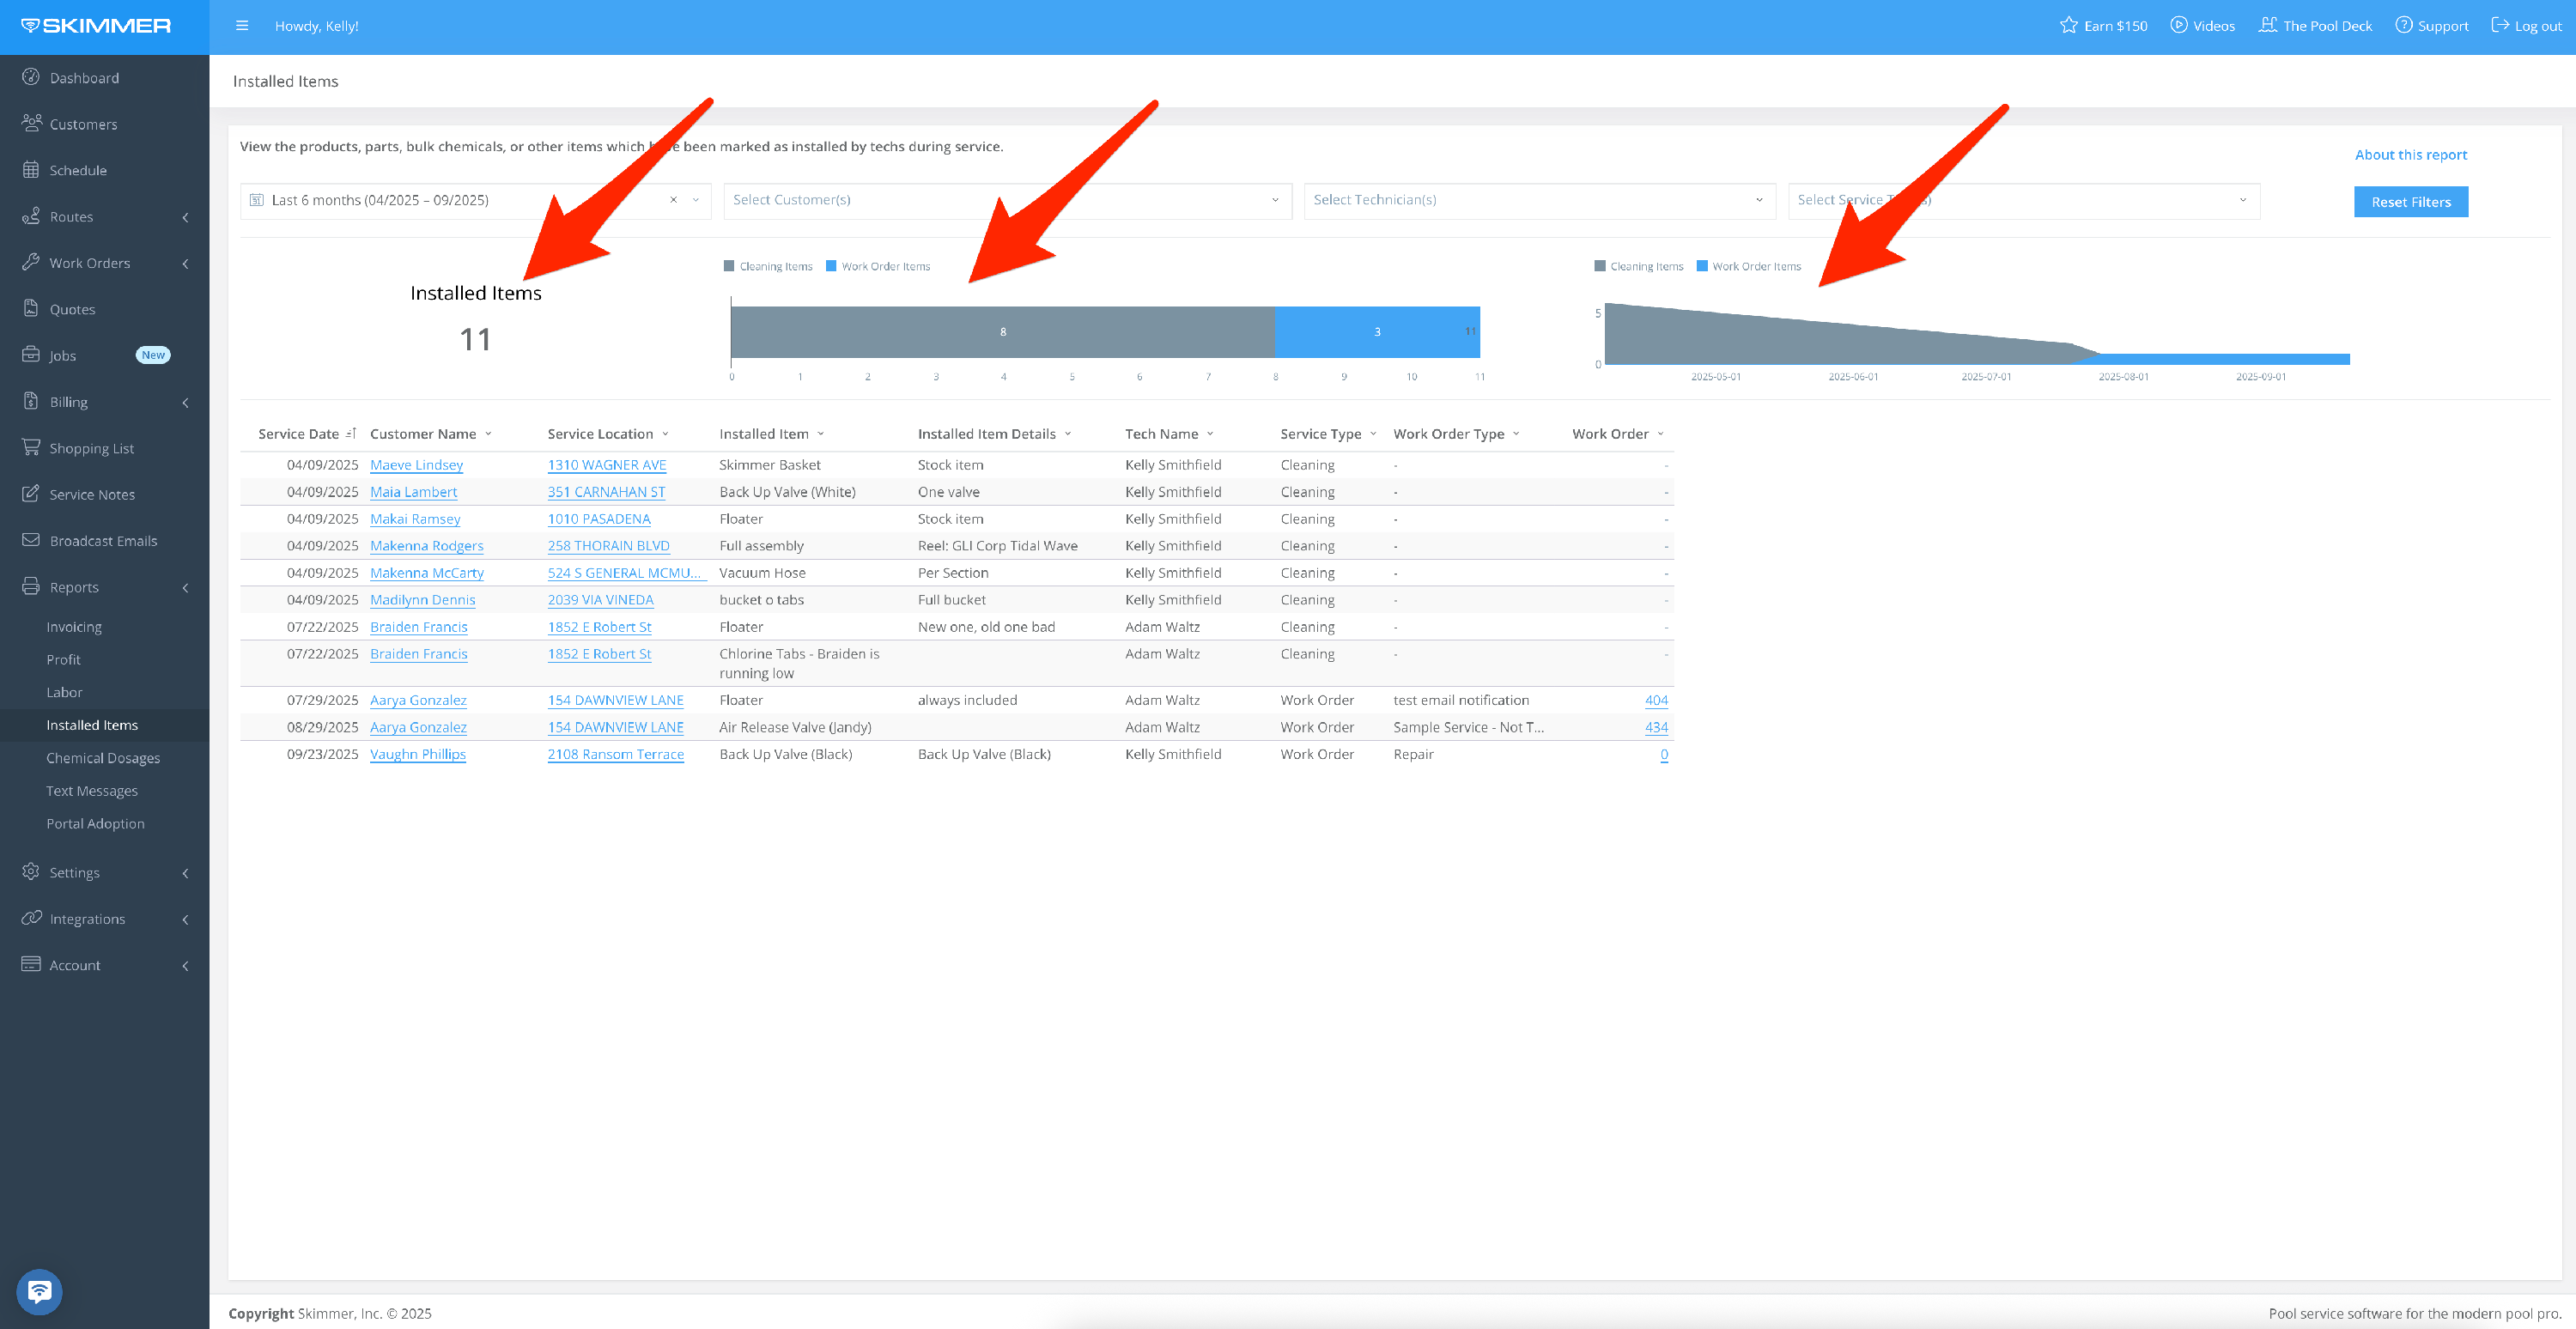
6. The second area gives you charts to help visualize the information.
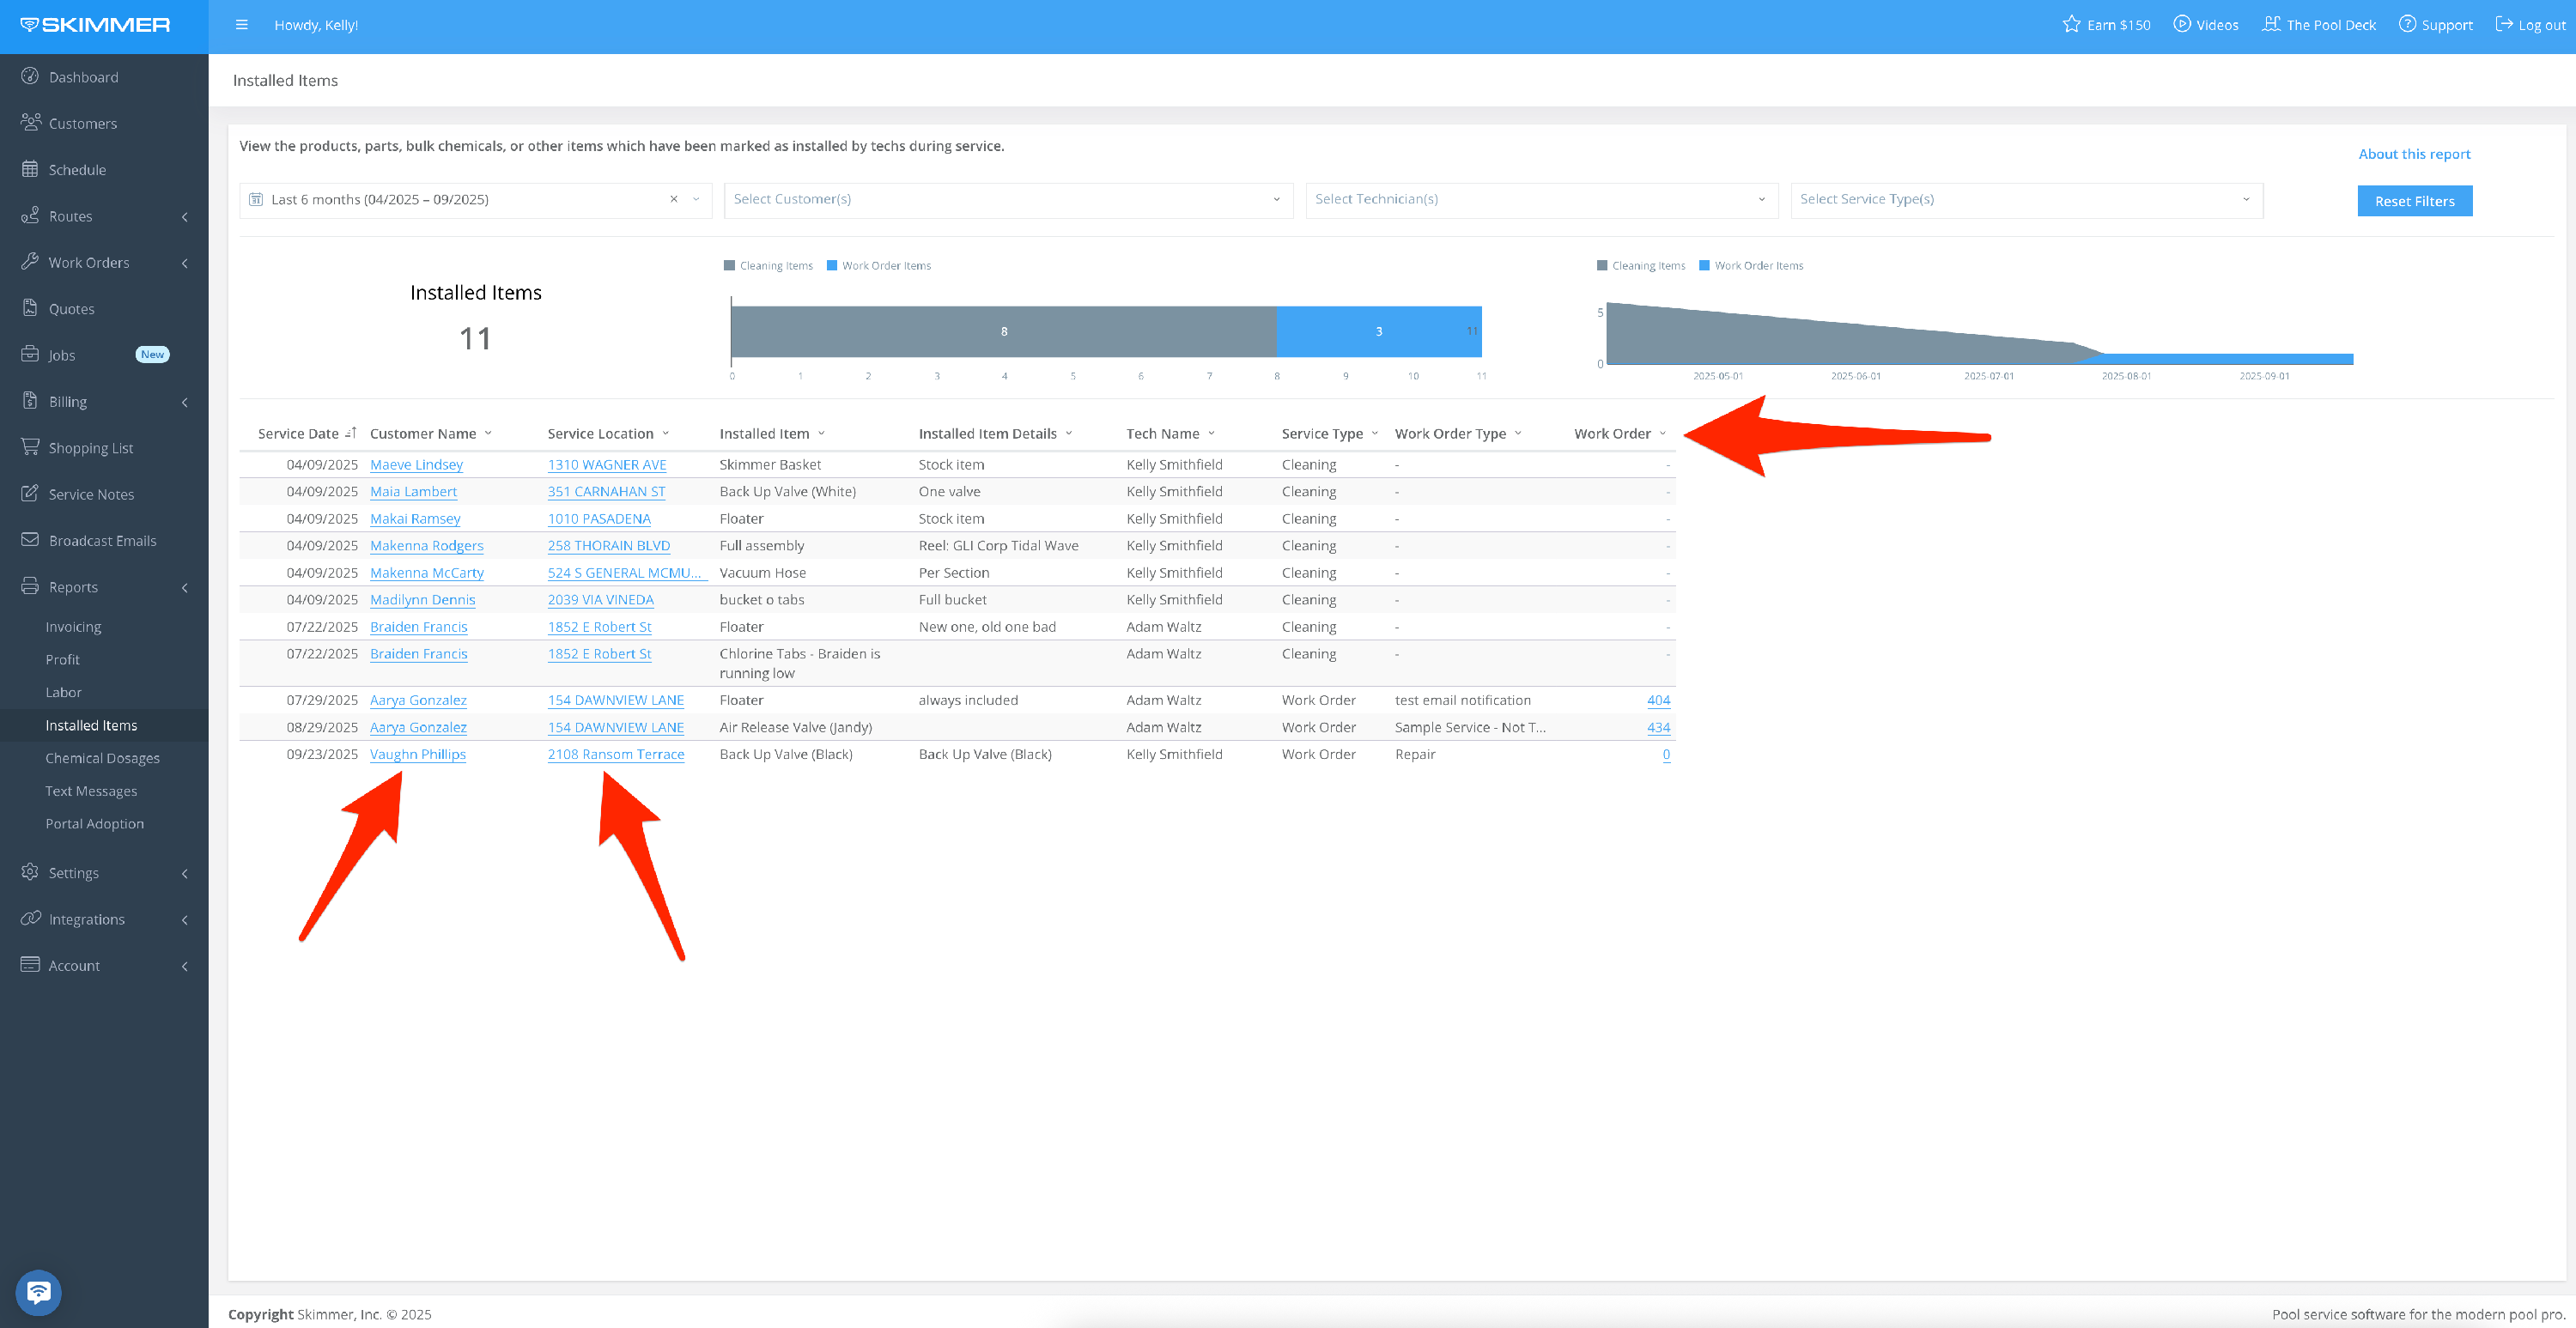
- It provides all service information associated with each installed item, including serviced date, customer name and location, the item installed, the tech who installed it, and the associated service type.
- Click a customer name to be taken to their profile
- Click a service location to be taken to the service location setup screen
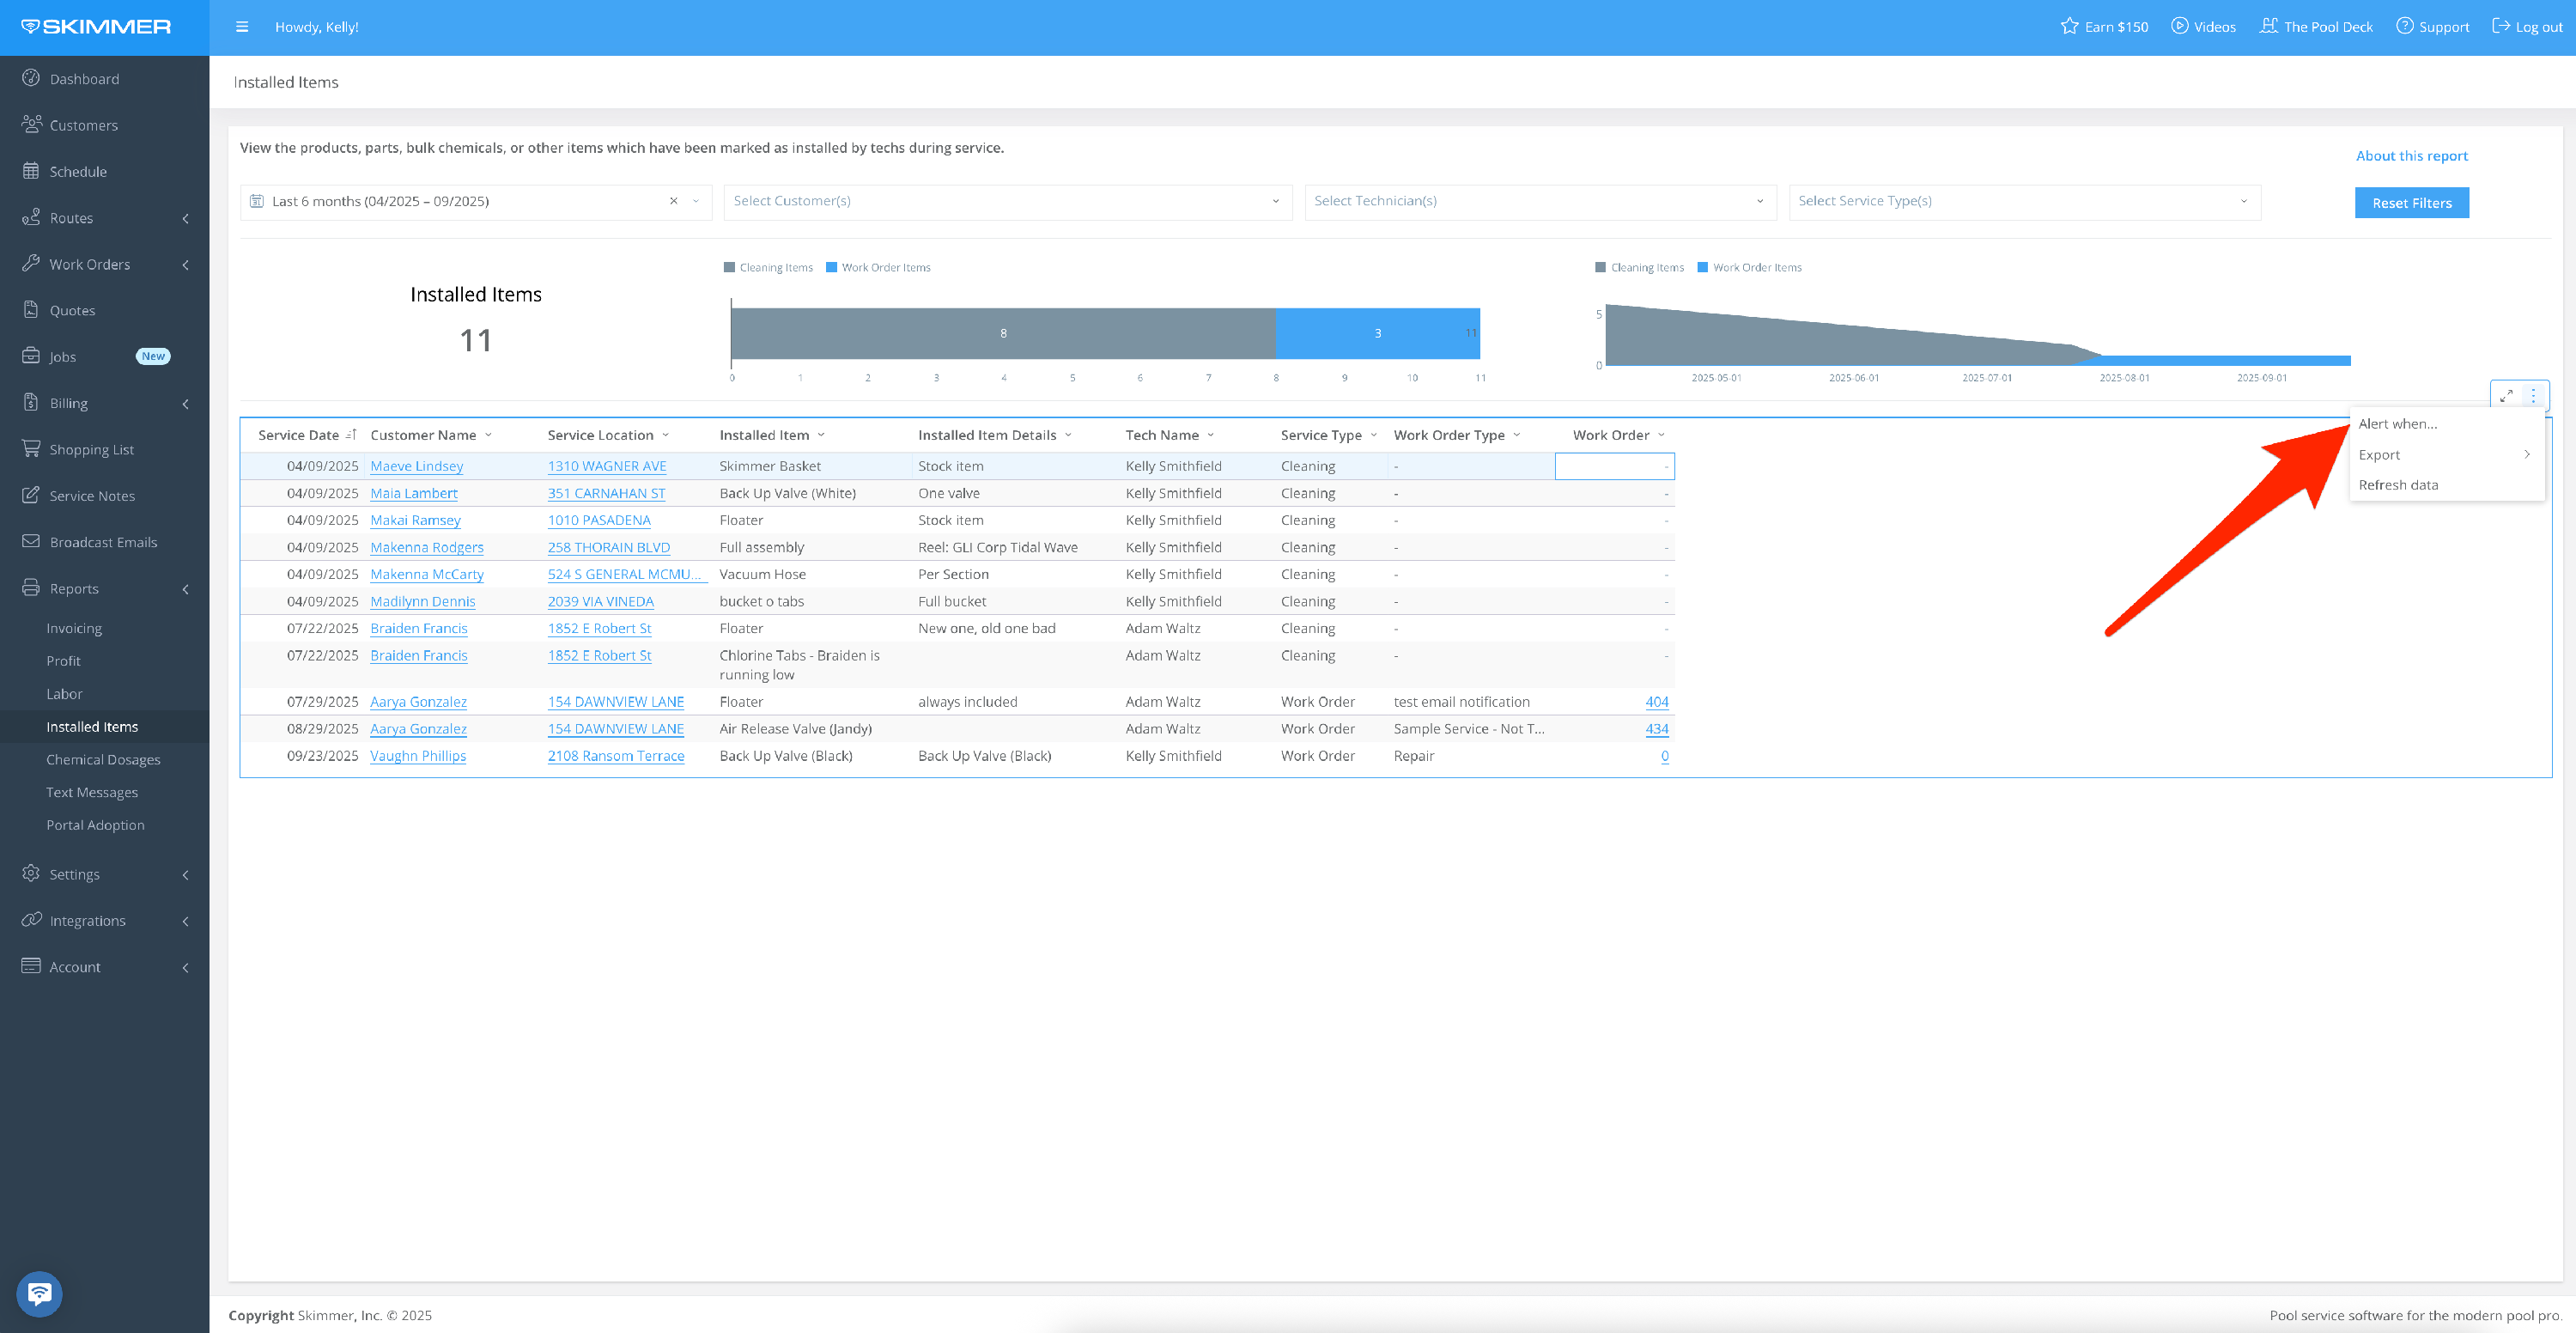
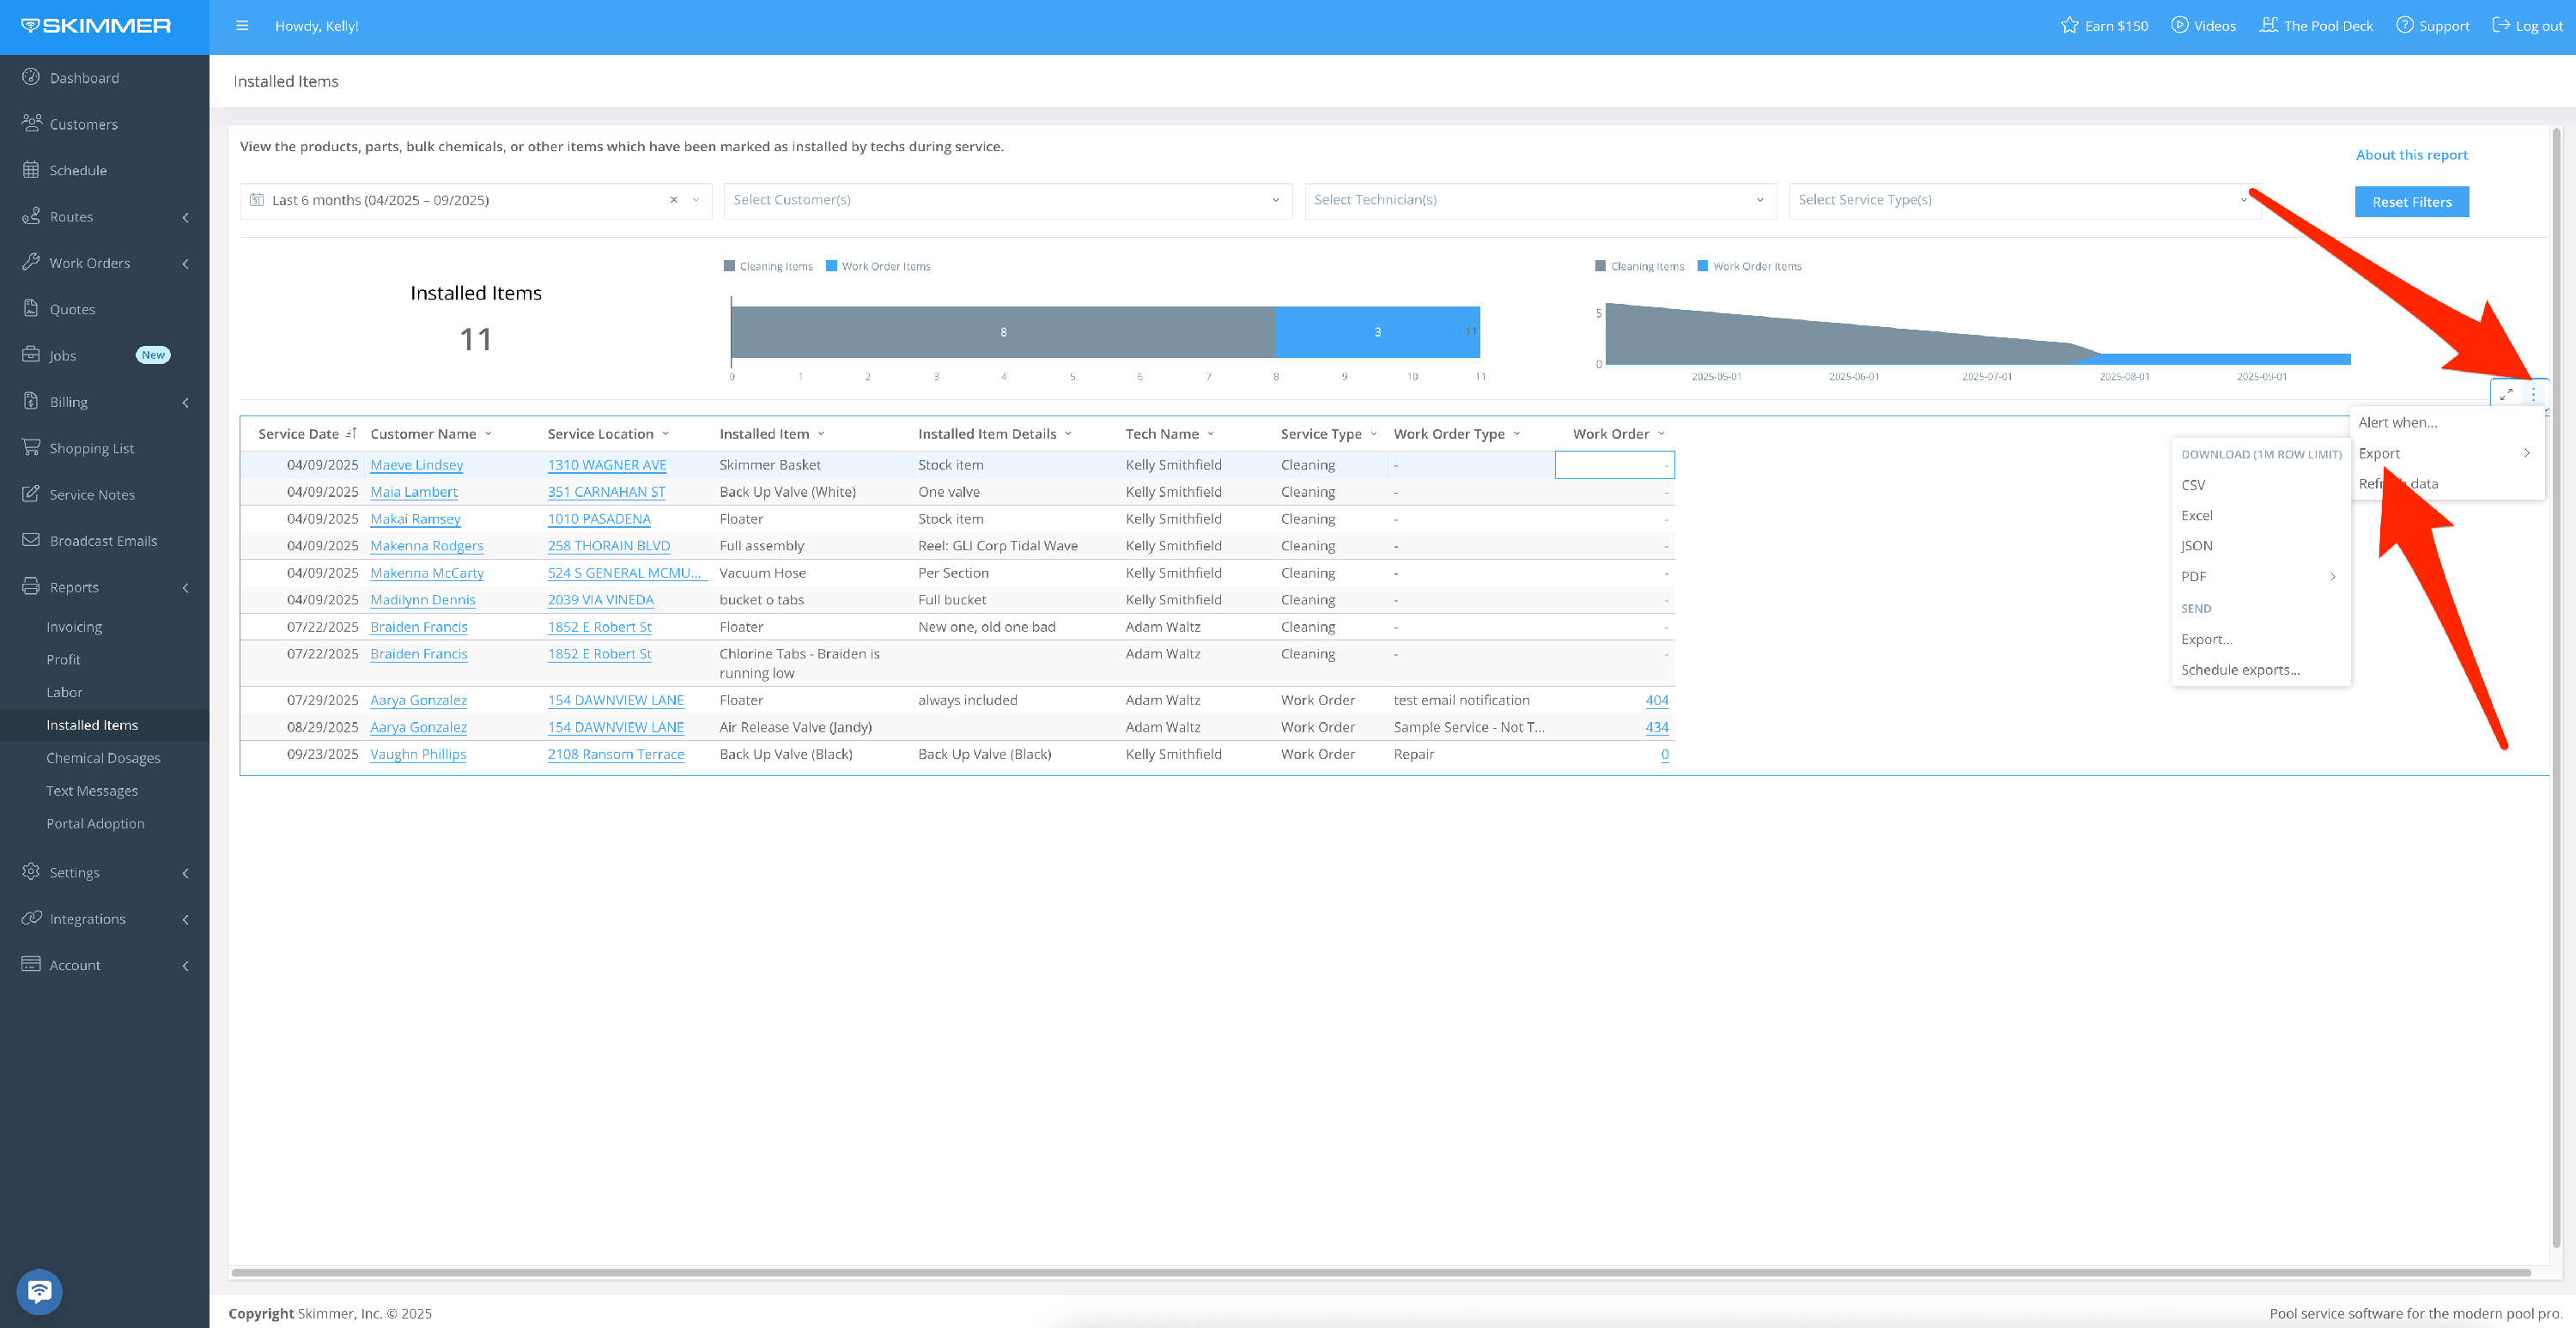
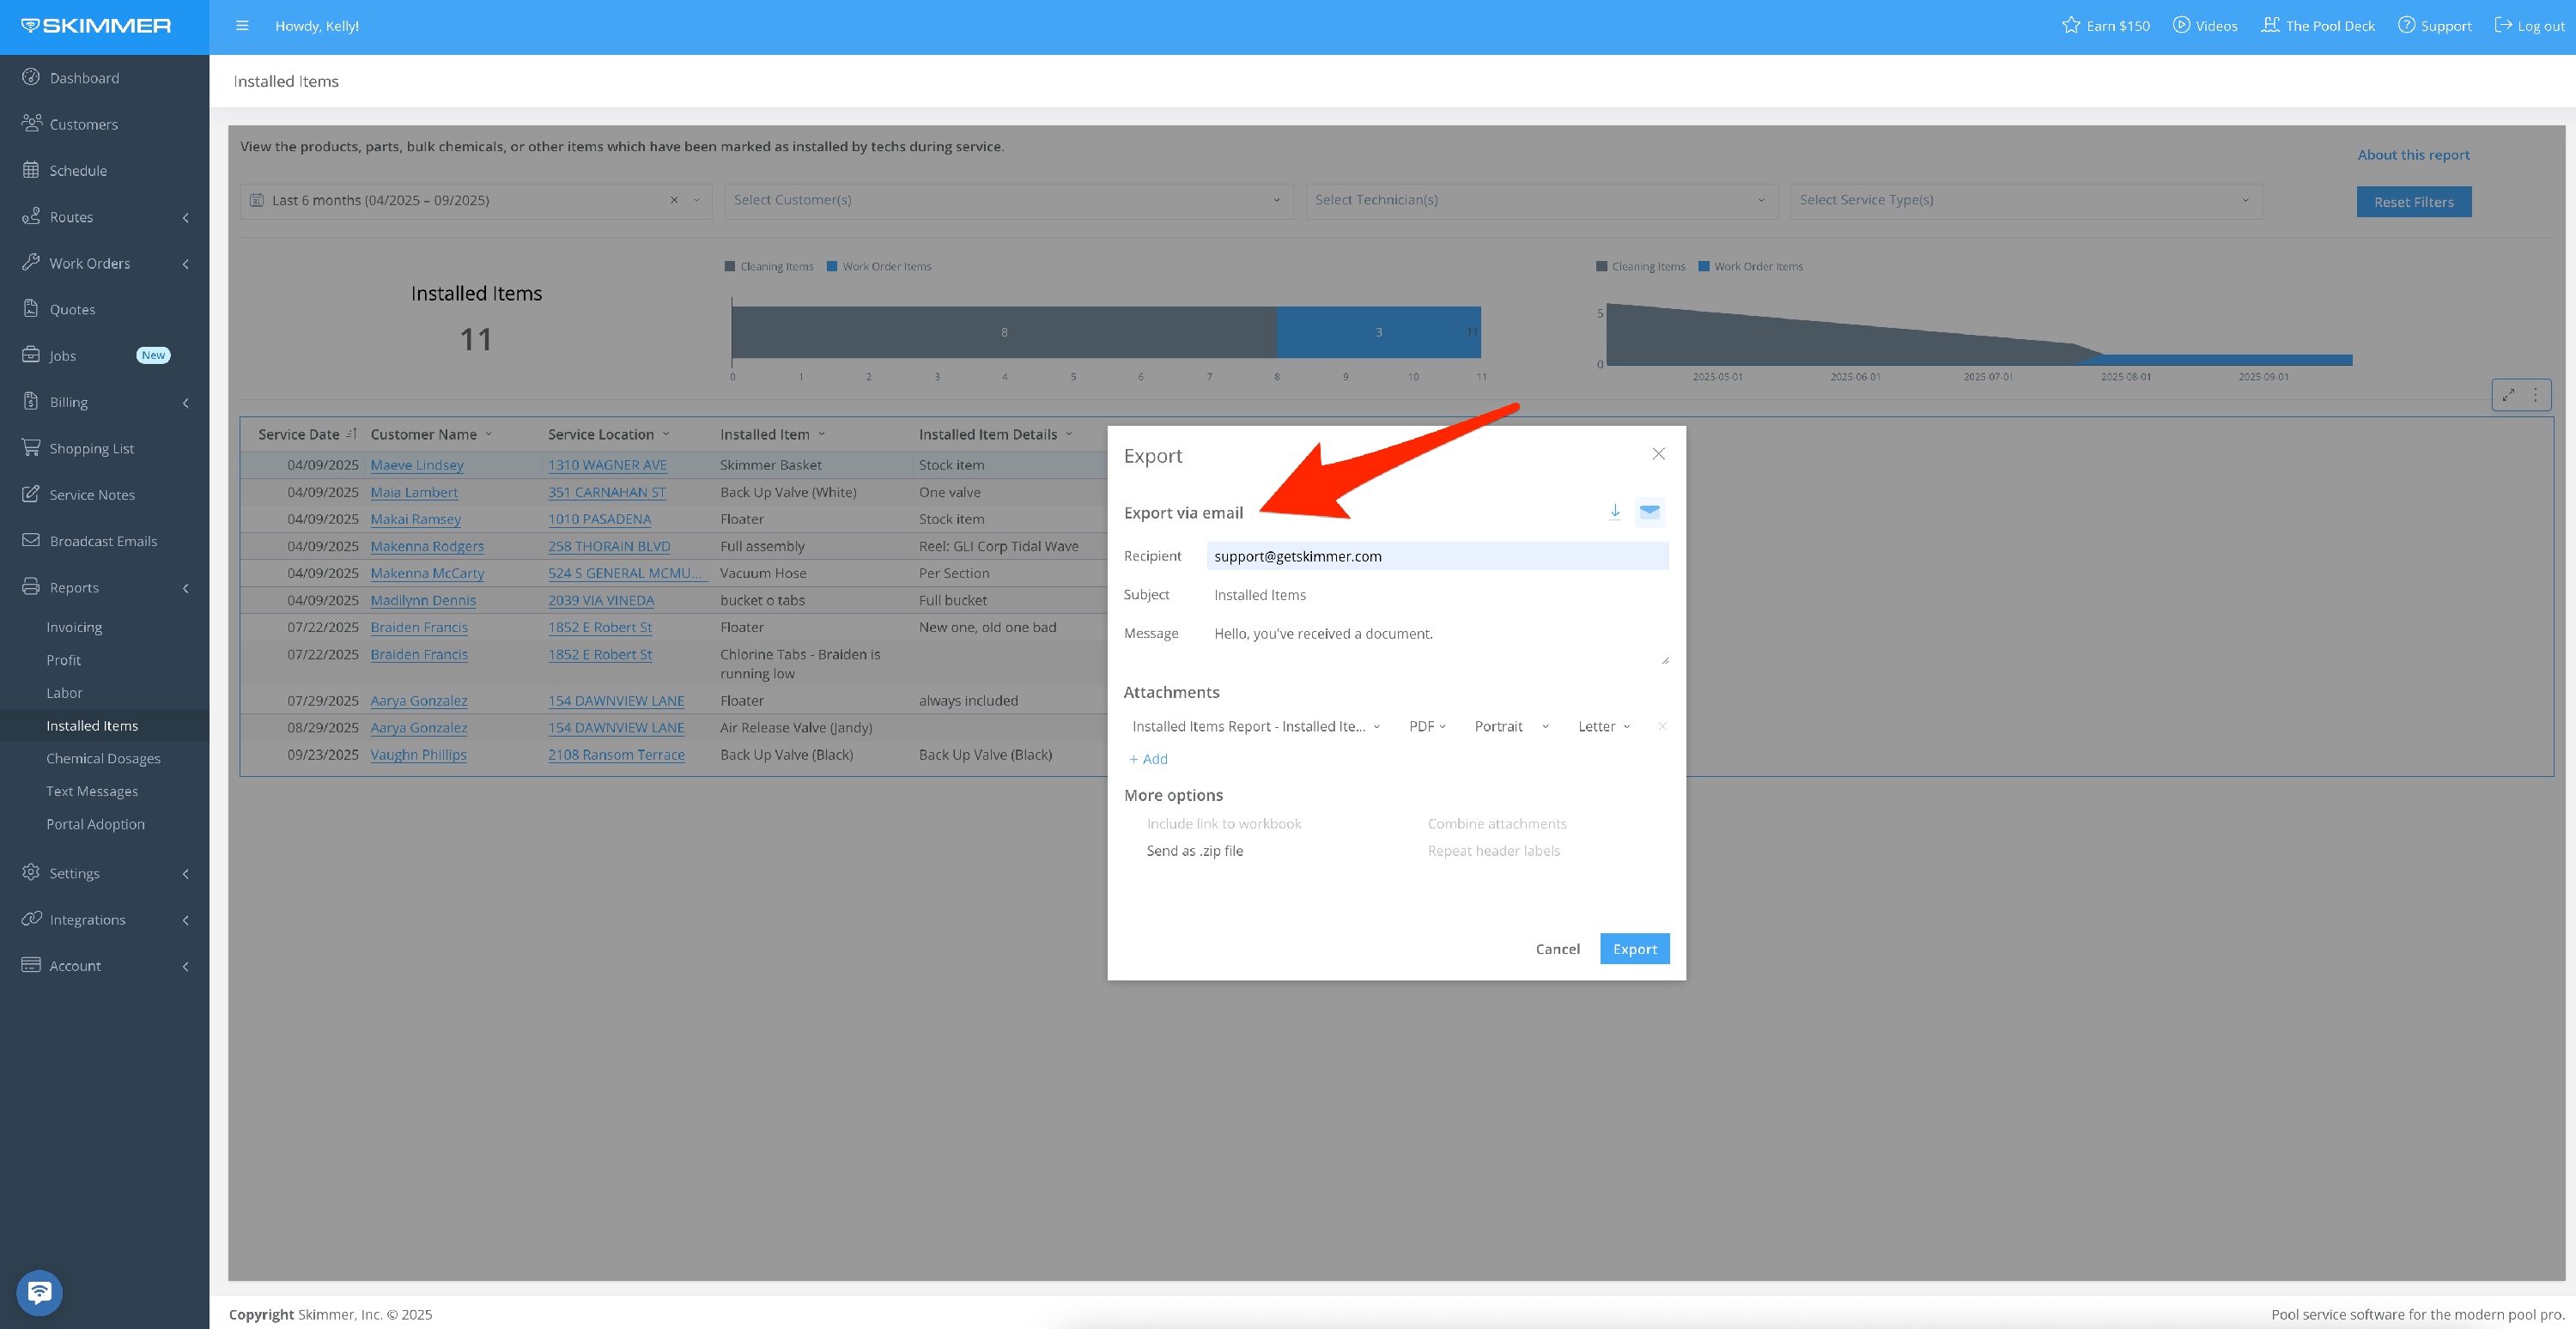
7. To export data:
- Hover or click on a chart or table.
- Find the three dots that appear in the top right of the frame and click. This will give you options for working with the data in the chart you selected, including the ability to export it in various formats to view and analyze the information in your own way.
- Exporting as a PDF or PNG will download an image of what you selected.
- Exporting to Excel or CSV will download a table with the underlying data directly to your computer.
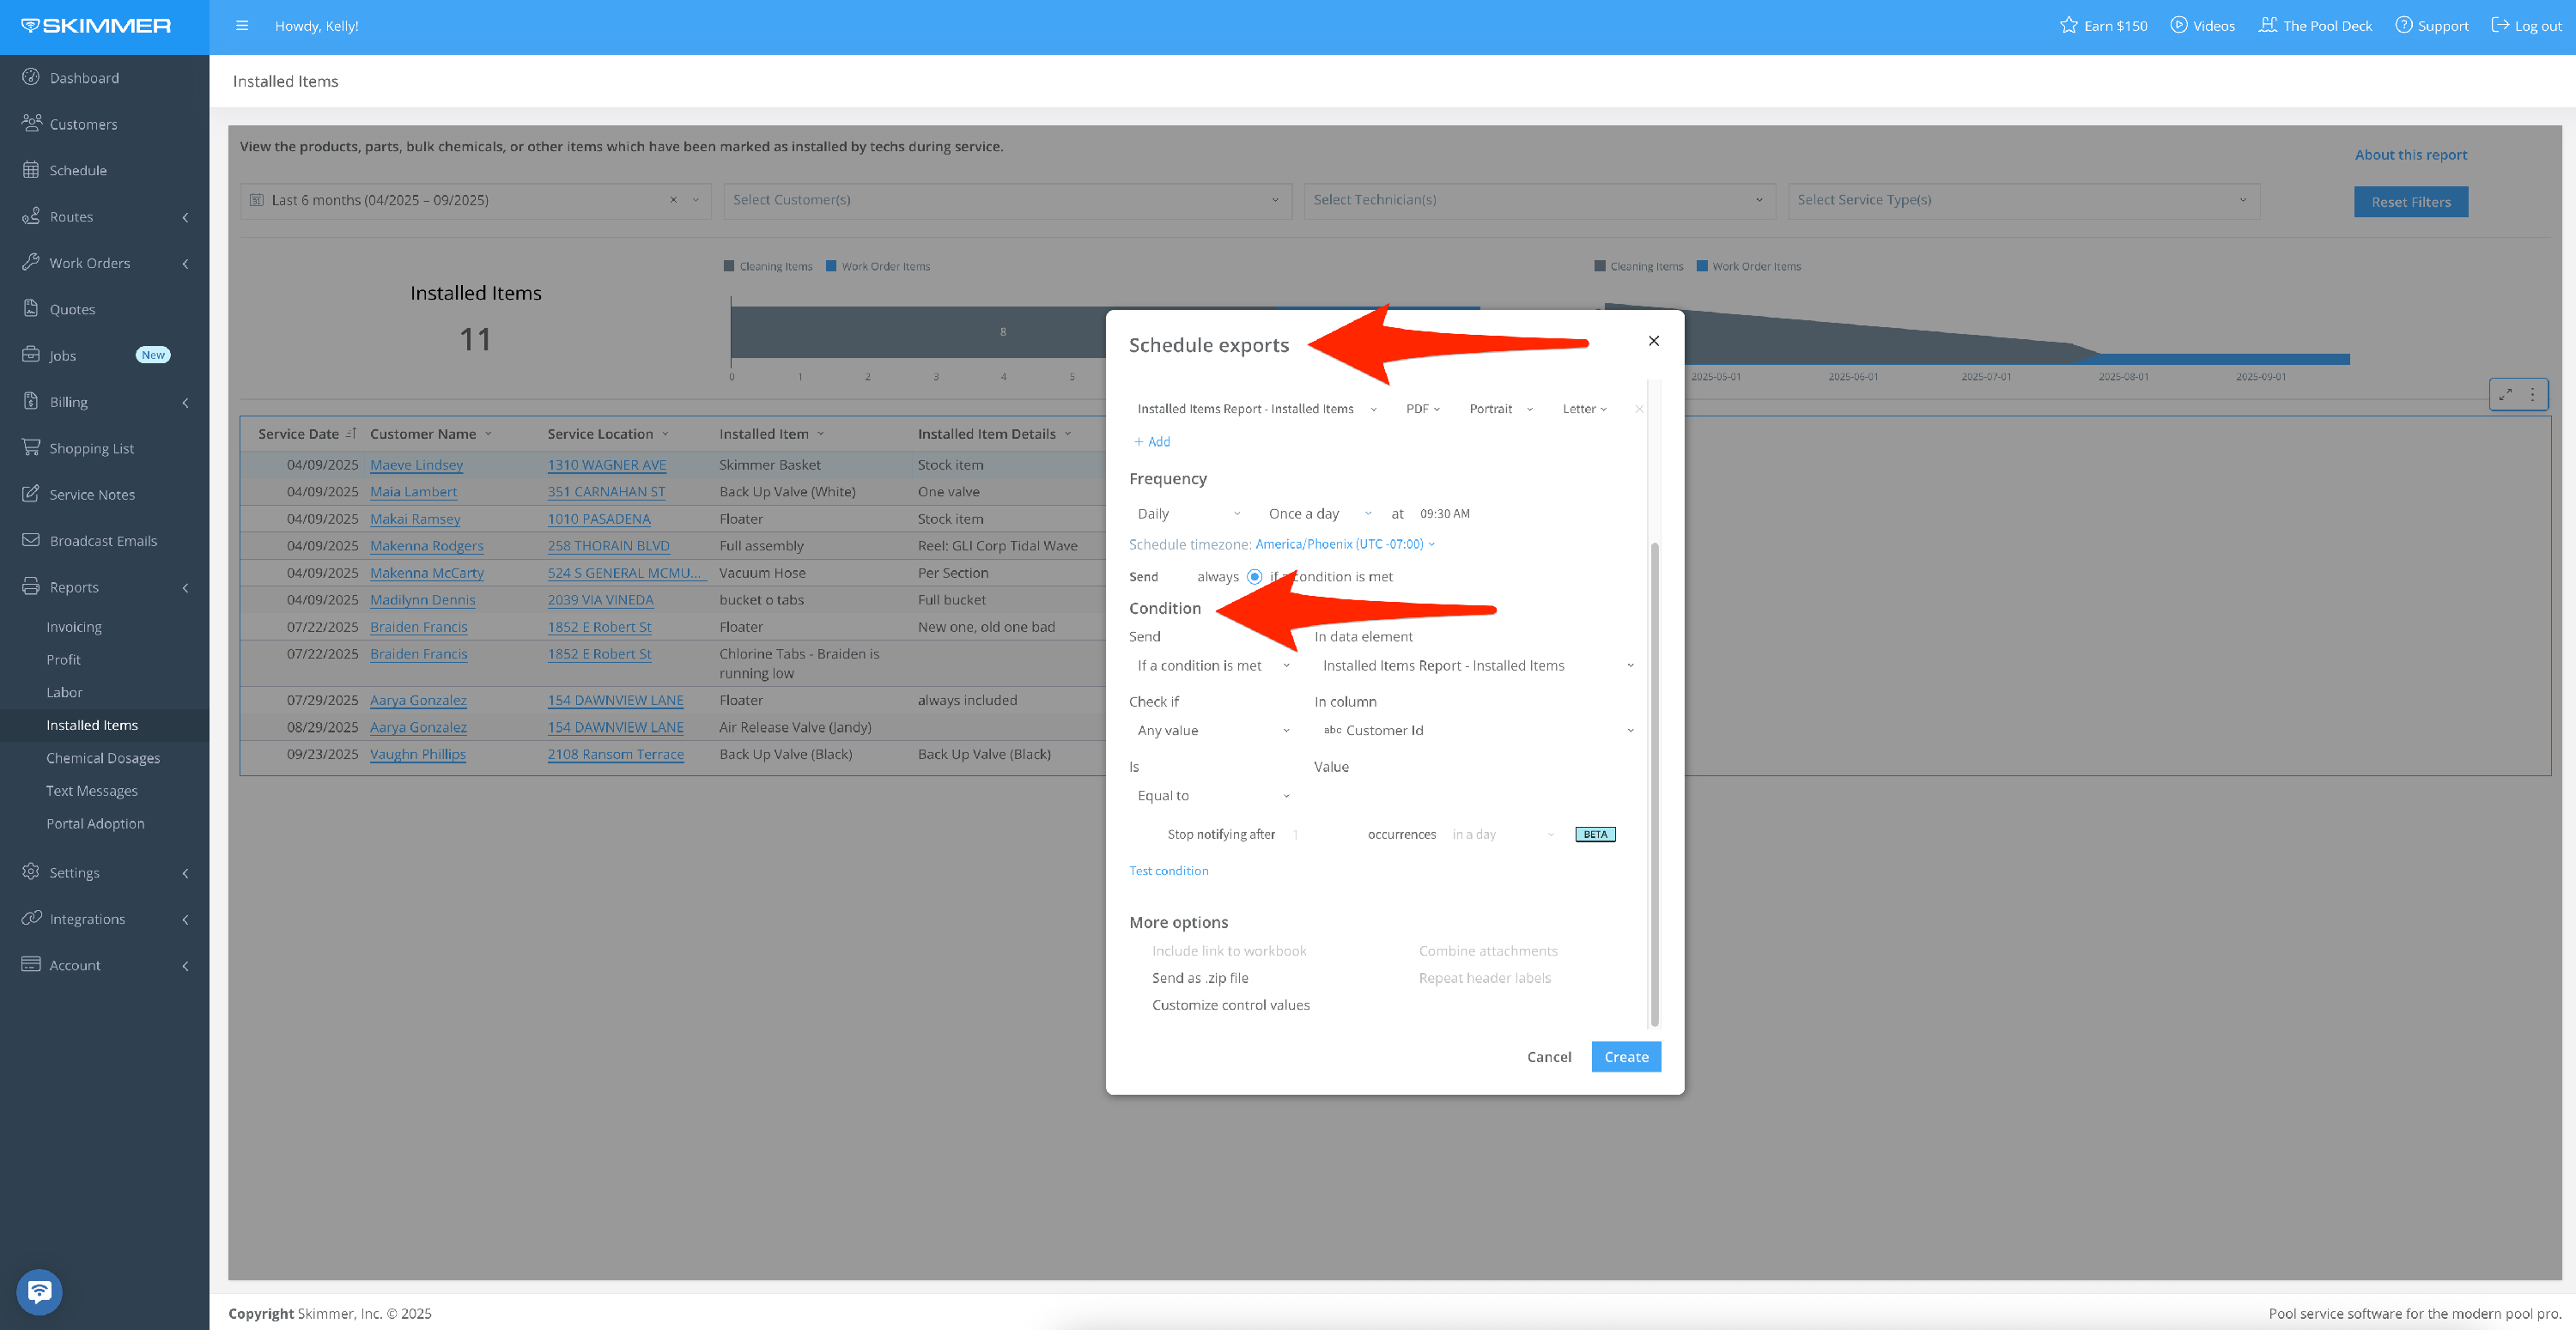
- You can also Send > Export, which also allows you email it. With the email option, you can also choose format and recipients, schedule a day and time for that email to send, and customize a schedule for a recurring email export going forward.
8. The “Alert When” option sets up an automatic export if the conditions you set are met.
- Choose for the export to trigger if your cost exceeds a certain amount. The system does the monitoring of this condition for you and then triggers the export automatically.
- You can also select what supporting data you want to be included in the export, from a high-level summation to the whole text messages table.
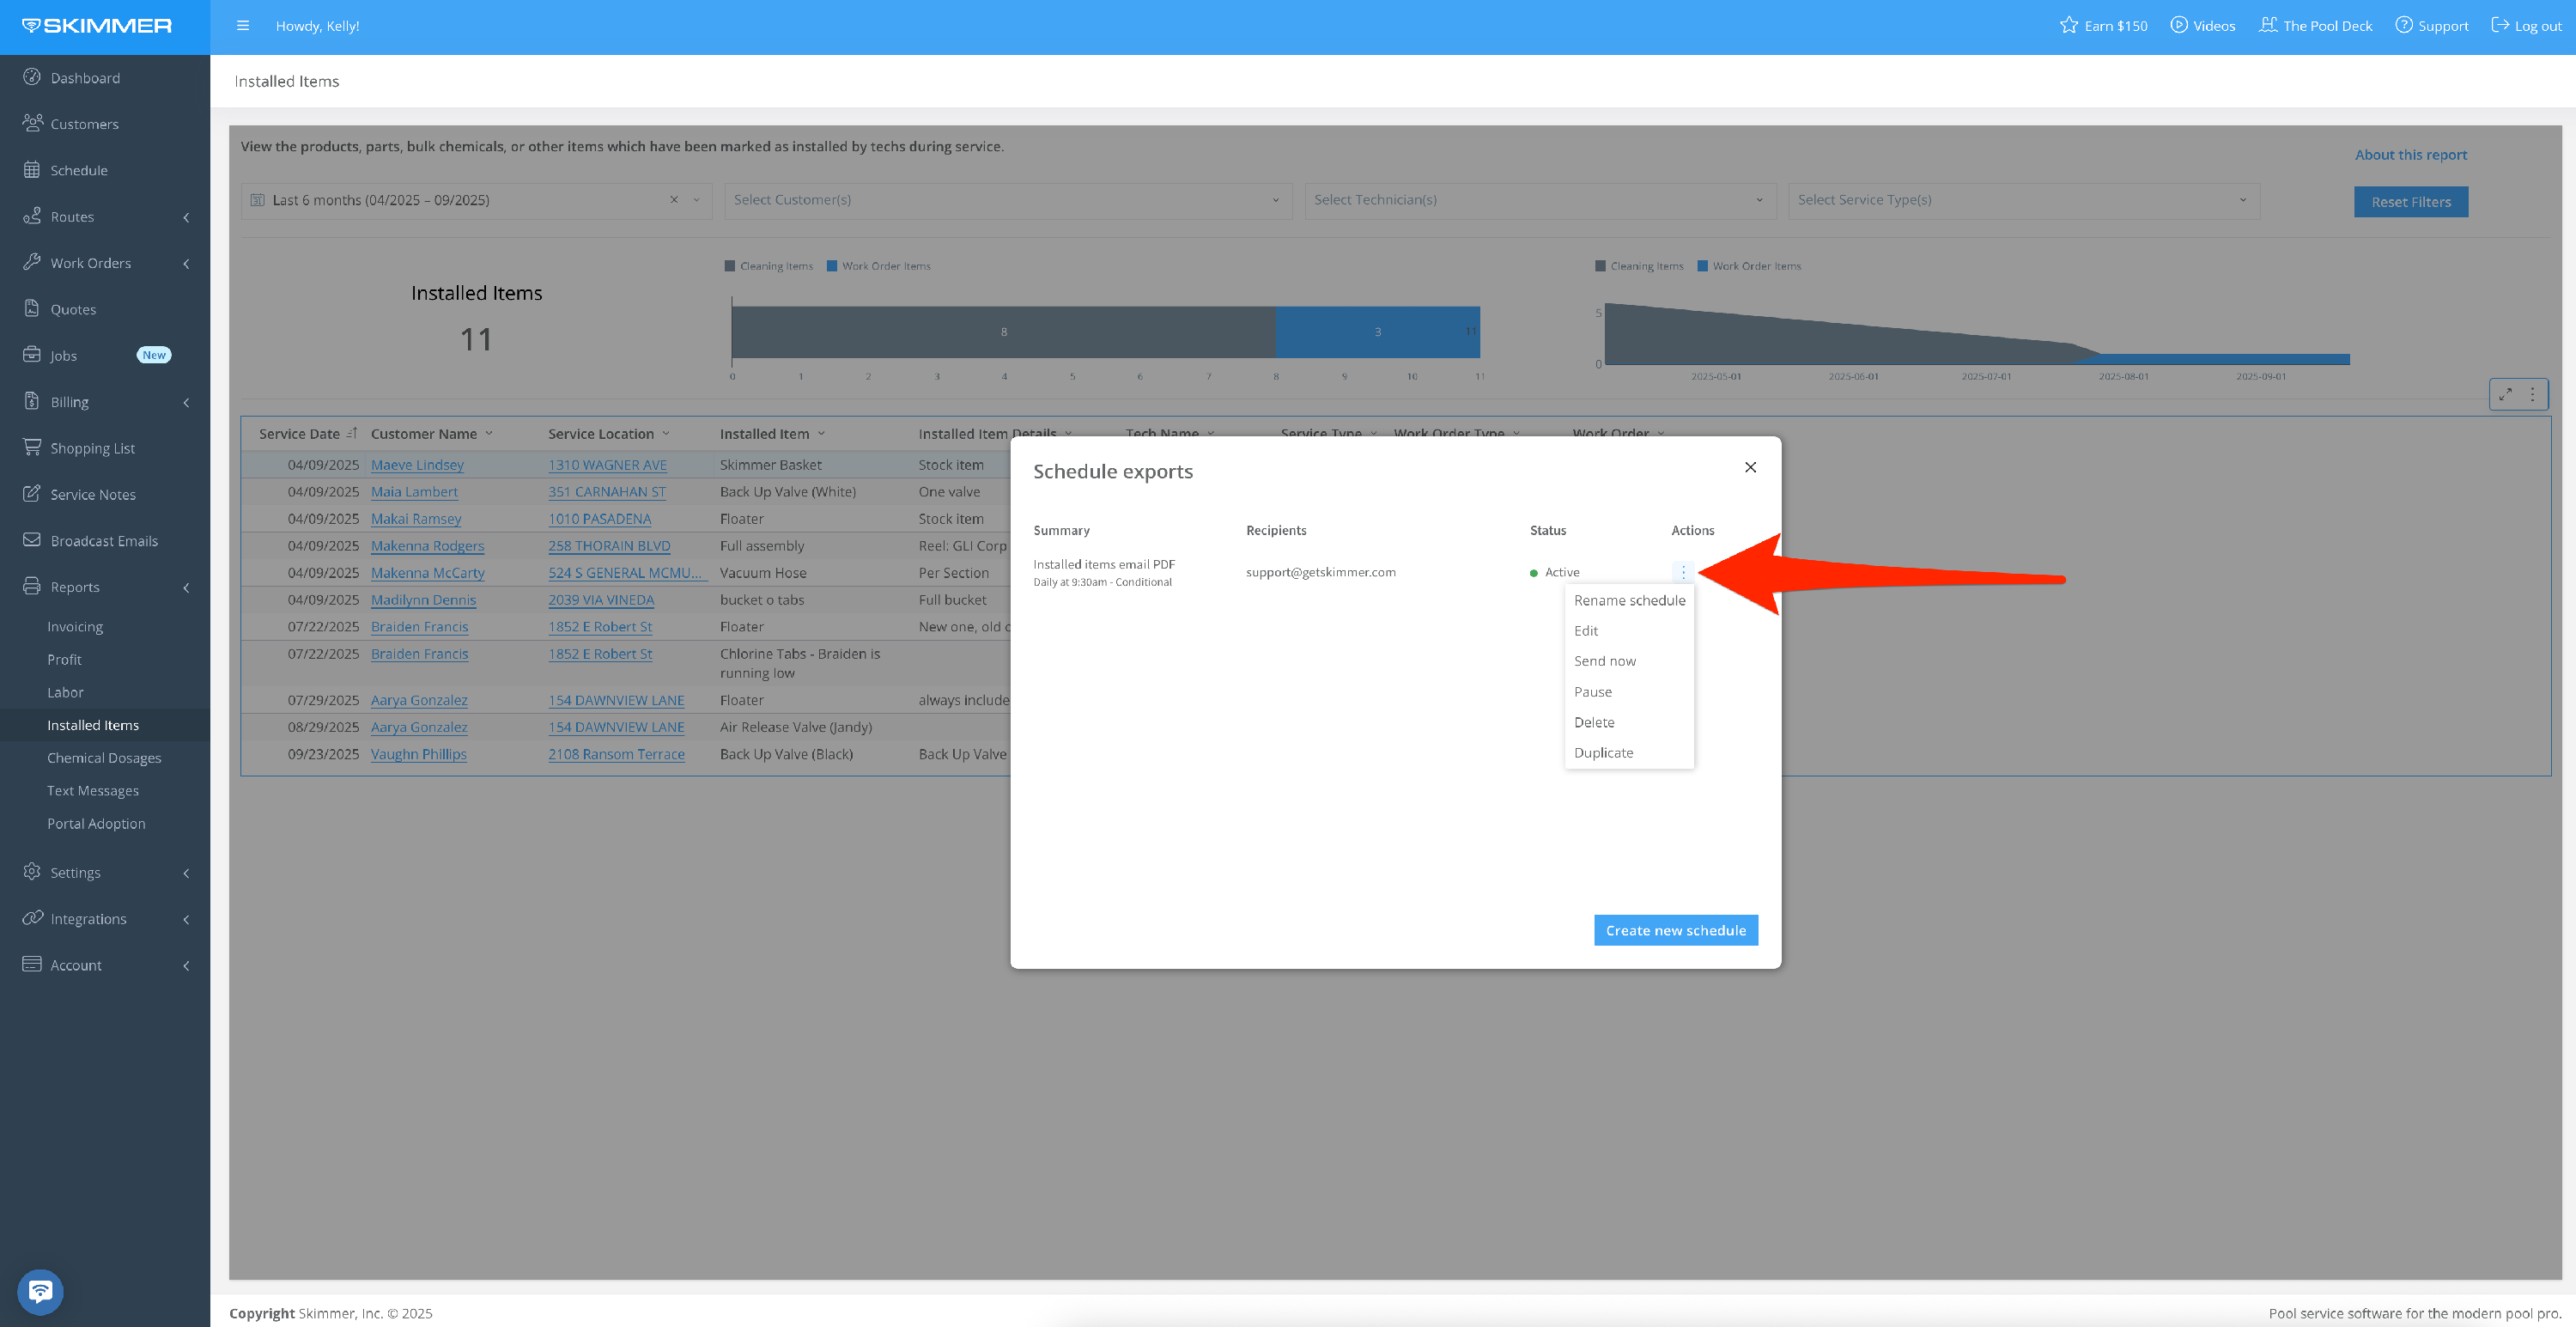
- Once you create a scheduled export, you’ll have access to a table from which you can manage all of your scheduled exports, allowing you to edit/delete/duplicate/pause/manually send report at any time.