
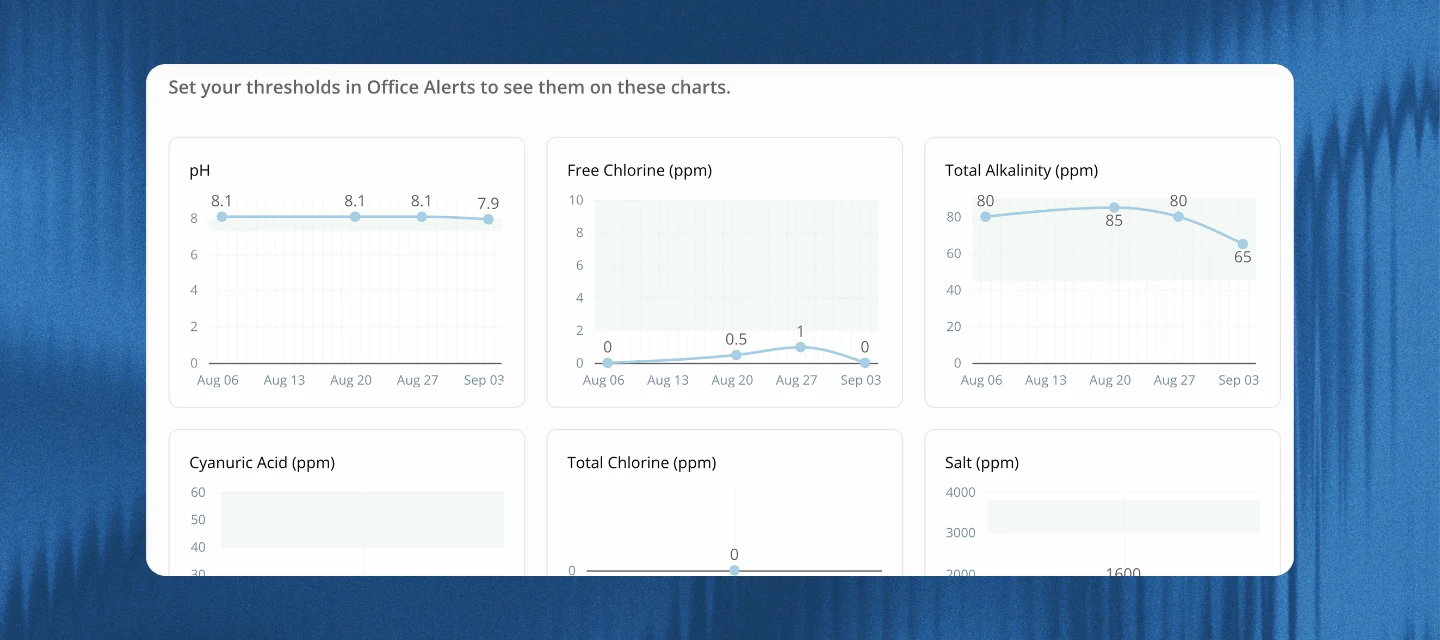



Finding a pool that's drifting out of range used to mean opening customer profiles one at a time, or exporting a CSV and doing the math yourself. The new readings report fixes that, and here's how to get the most out of it.
What it does
The readings report shows every pool you service in one list, with the last service date and whether any readings came back outside the ranges you've set. No more clicking into each pool to find out something's wrong. Click into any pool from that list and you'll get trend charts for each reading type, plus a full readings and dosages history with out-of-range values highlighted.
You'll find it under Reports > Readings, and you'll also see the latest readings and dosages right on each customer's body of water tab.
Set it up first: Office Alerts thresholds
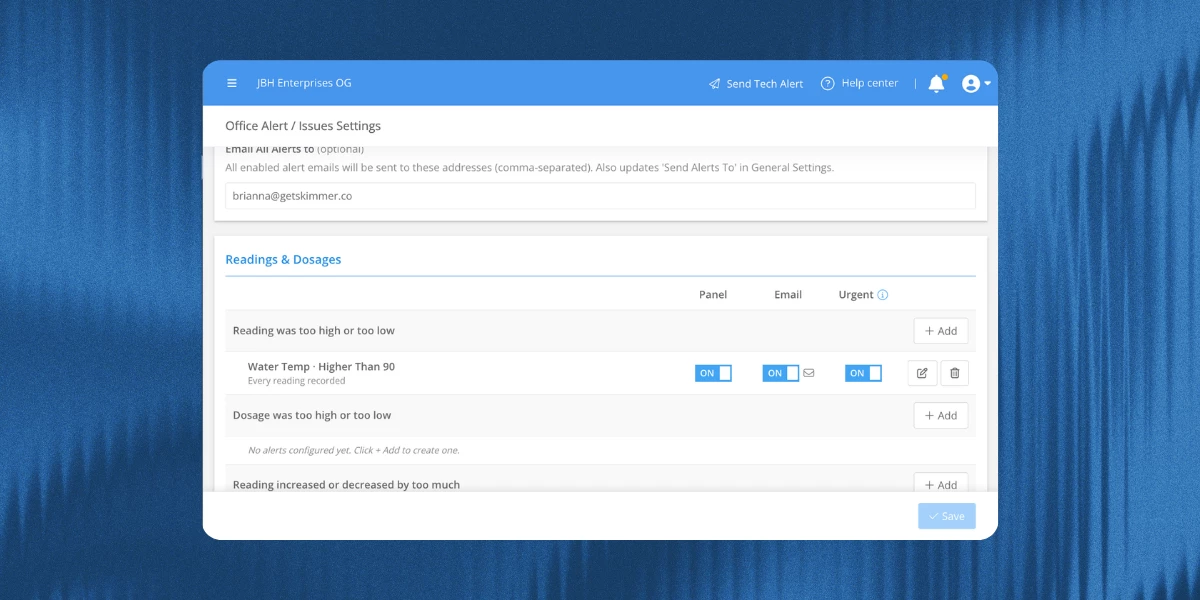
Before the report can flag anything as too high or too low, it needs to know what "too high" and "too low" mean for your business. It pulls those ranges from your Office Alerts settings.
Go to your Office Alerts / Issues settings and set thresholds for "Reading was too high or too low" on the readings you care about most, like free chlorine or pH. This is quick to set up and you don't need to turn on the Panel, Email, or Urgent options for it to work. Once it's set, you'll get:
- Green range bands on your trend charts
- Red highlighting on out-of-range values in the readings and dosages table
- "Out of range" and "In range" statuses in the summary view
The report still works without thresholds set (last service date, tech, and "no readings" status all show up regardless), but the ranges are what unlock most of its value.
How to read it
The report has two views:
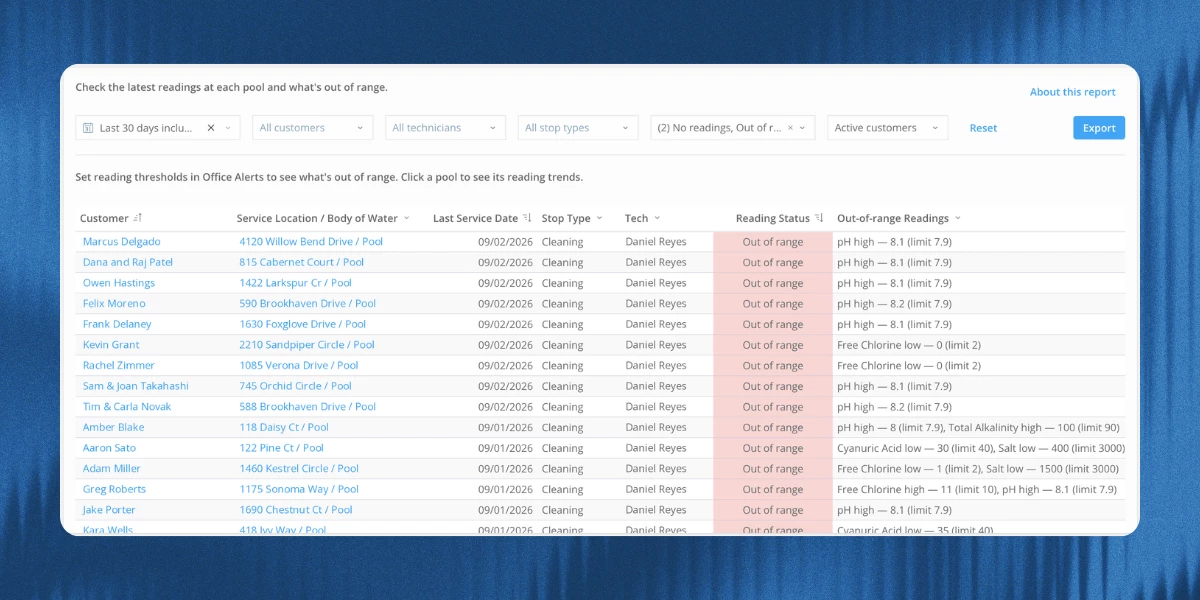
1. Summary view
This is where it opens. It lists every pool with its last service date, tech, stop type, and reading status, so you can scan your whole book of business in one pass. Filter by date, customer, tech, stop type, or reading status to narrow it down, like pulling up just the pools flagged "out of range" or "no readings" this week.
2. Reading trends view
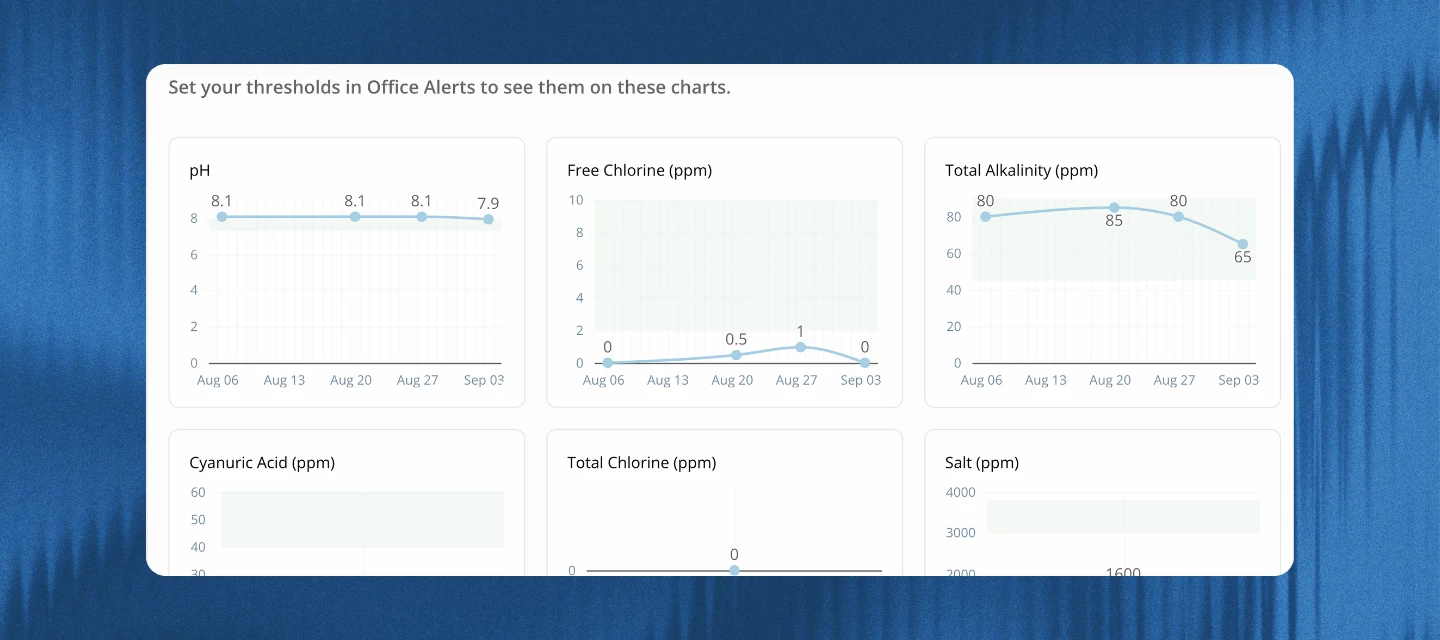
Click into any pool from the summary view to see this. You'll get a chart for each reading type, so you can tell in seconds whether a reading is a one-off or a pattern that's been building, like free chlorine sliding down stop after stop. Below the charts is the full readings and dosages history table, with out-of-range values highlighted.
Make it a habit
Pull up the report daily or weekly to catch pools that need attention before the customer calls. It's also worth a look when you want to export a pool's history for your records or to share with a customer, or when you want to see which pools a tech hasn't logged readings for lately.
Learn more about the readings report here → https://help.getskimmer.com/article/351-readings-report